This article organizes step-by-step instructions for deploying, exposing, and managing Kubernetes workloads, handling connectivity issues, and ensuring self-healing deployments with K3s. These notes represent the of my personal experiments with K3s.
Install K3s
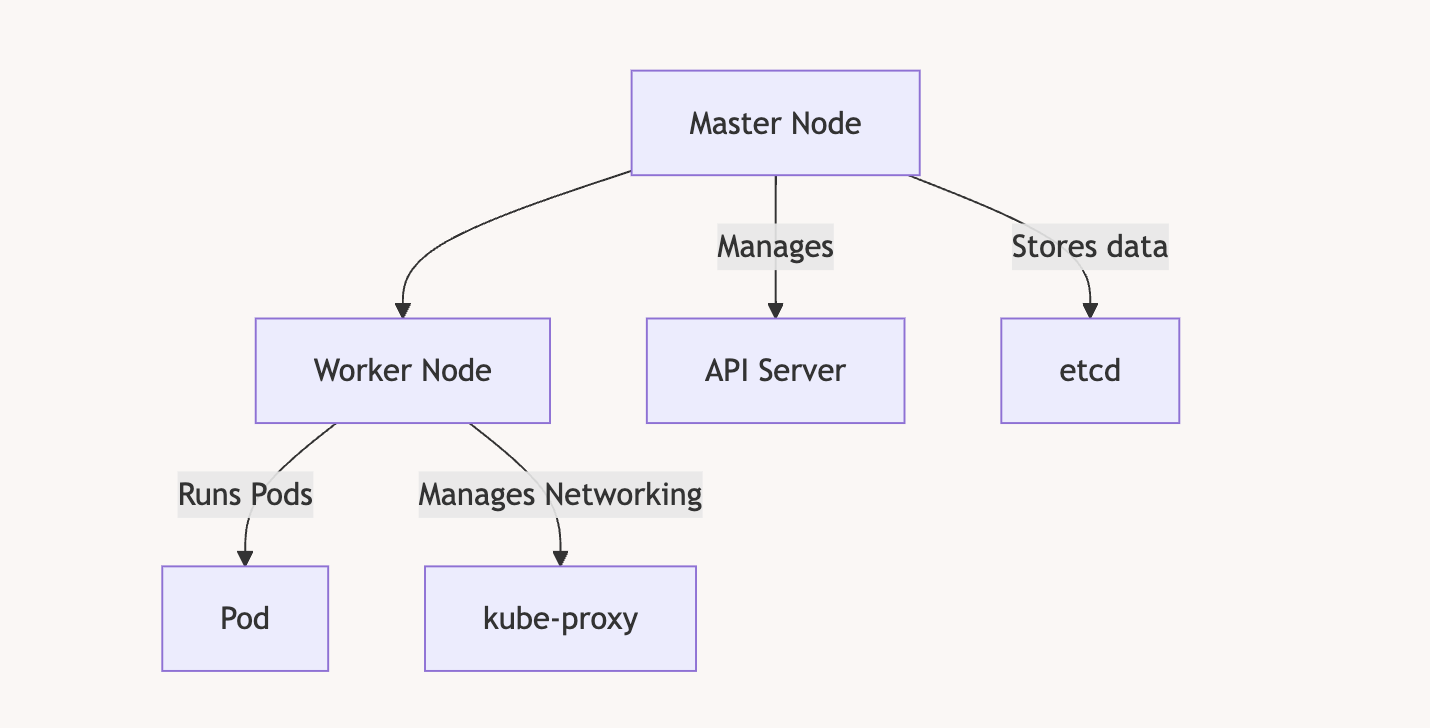
To install K3S, you need at least 2 VMs. In my case, I decided to use Debian VMs on Proxmox. The first VM will be the master node, and the second will be the worker node. The master node orchestrates the cluster and distributes the load across one or more worker nodes. As your application grows and requires more machines, you can simply add more worker nodes to the cluster.
Install the master node
curl -sfL https://get.k3s.io | sh -
Get the token
cat /var/lib/rancher/k3s/server/token
It will return something like
root@k8masterNode:~# cat /var/lib/rancher/k3s/server/token
K10ee9c18dac933cab0bdbd1c64ebece61a4fa7ad60fce2515a5fcfe19032edd707::server:64ee8a3fec9c3d1db6c2ab0fc40f8996
Get the IP of the machine
root@k8masterNode:~# ip addr show | grep 192
    inet 192.168.1.67/24 brd 192.168.1.255 scope global dynamic ens18
Join the cluster from the worker node
NB : Be sure the worker node has a different hostname otherwise it will not work
If the VM has been cloned then run : sudo hostnamectl set-hostname <new-hostname>
curl -sfL https://get.k3s.io | K3S_URL=https://<server-ip>:6443 K3S_TOKEN=<token> sh -
curl -sfL https://get.k3s.io | K3S_URL=https://192.168.1.67:6443 K3S_TOKEN="K10ee9c18dac933cab0bdbd1c64ebece61a4fa7ad60fce2515a5fcfe19032edd707::server:64ee8a3fec9c3d1db6c2ab0fc40f8996" sh -
Creating and Exposing Deployments
Create a Deployment
kubectl create deployment nginx --image=nginx
Expose the Deployment
kubectl expose deployment nginx --type=NodePort --port=80
Verify the service:
kubectl get svc
Expected output:
NAME         TYPE        CLUSTER-IP     PORT(S)        AGE
nginx        NodePort    10.43.212.89   80:30548/TCP   6s
Verify the pods:
kubectl get pods -o wide
Example:
NAME                    READY   STATUS    IP          NODE
nginx-bf5d5cf98-knd5t   1/1     Running   10.42.1.3   workernode
Access the Nginx App:
curl http://<CLUSTER-IP>
curl http://<MASTER-IP>:<NODEPORT>
Example:
curl http://192.168.1.49
Or with the port like so (we deployed on port 80)
curl http://192.168.1.49:80
Managing a Deployment
Remove a Deployment
Delete the service:
kubectl delete service nginx
Delete the deployment :
kubectl delete deployment nginx
Confirm deletion:
kubectl get deployments
kubectl get svc
Building and Pushing Custom Docker Images
Build the Docker Image
Ensure your app is ready for deployment:
docker build -t node-express-app .
Login to DockerHub
docker login
Tag and Push the Image
docker tag node-express-app antoinebr/node-express-app:v1
docker push antoinebr/node-express-app:v1
Deploying Custom Applications
Create a Deployment YAML
Save as node-express-deployment.yaml:
apiVersion: apps/v1
kind: Deployment
metadata:
  name: node-express-app
spec:
  replicas: 6
  selector:
    matchLabels:
      app: node-express-app
  template:
    metadata:
      labels:
        app: node-express-app
    spec:
      containers:
      - name: node-express-app
        image: antoinebr/node-express-app:v1
        ports:
        - containerPort: 3000
Apply the Deployment
kubectl apply -f node-express-deployment.yaml
Expose the Deployment
kubectl expose deployment node-express-app --port=80 --target-port=3000 --type=NodePort
Get App IP
kubectl get svc node-express-app
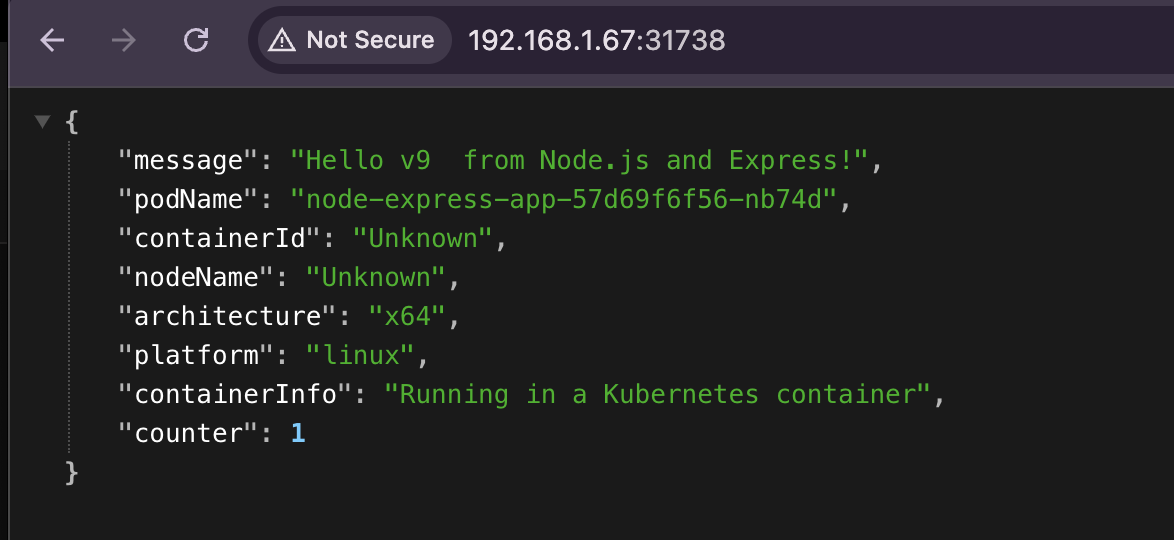
You will get something like :
root@k8masterNode:~# kubectl get svc node-express-app
NAME               TYPE       CLUSTER-IP      EXTERNAL-IP   PORT(S)        AGE
node-express-app   NodePort   10.43.239.152   <none>        80:31738/TCP   3m33s
Access the App:
curl http://<MASTER-IP>:<NODEPORT>
In my case :
curl http://192.168.1.67:31738
NB: To remove that deployement kubectl delete deployment node-express-app
Using an Ingress Controller
Deployment and Service Configurations
Create deployment.yaml:
apiVersion: apps/v1
kind: Deployment
metadata:
  name: node-express-app
spec:
  replicas: 3
  selector:
    matchLabels:
      app: node-express-app
  template:
    metadata:
      labels:
        app: node-express-app
    spec:
      containers:
      - name: node-express-app
        image: antoinebr/node-express-app:v1
        ports:
        - containerPort: 3000
Create service.yaml:
apiVersion: v1
kind: Service
metadata:
  name: node-express-app
spec:
  selector:
    app: node-express-app
  ports:
  - protocol: TCP
    port: 80
    targetPort: 3000
  type: ClusterIP
Create ingress.yaml:
apiVersion: networking.k8s.io/v1
kind: Ingress
metadata:
  name: node-express-ingress
  annotations:
    nginx.ingress.kubernetes.io/rewrite-target: /
spec:
  rules:
  - host: node-express.local
    http:
      paths:
      - path: /
        pathType: Prefix
        backend:
          service:
            name: node-express-app
            port:
              number: 80
Apply Configurations
kubectl apply -f deployment.yaml
kubectl apply -f service.yaml
kubectl apply -f ingress.yaml
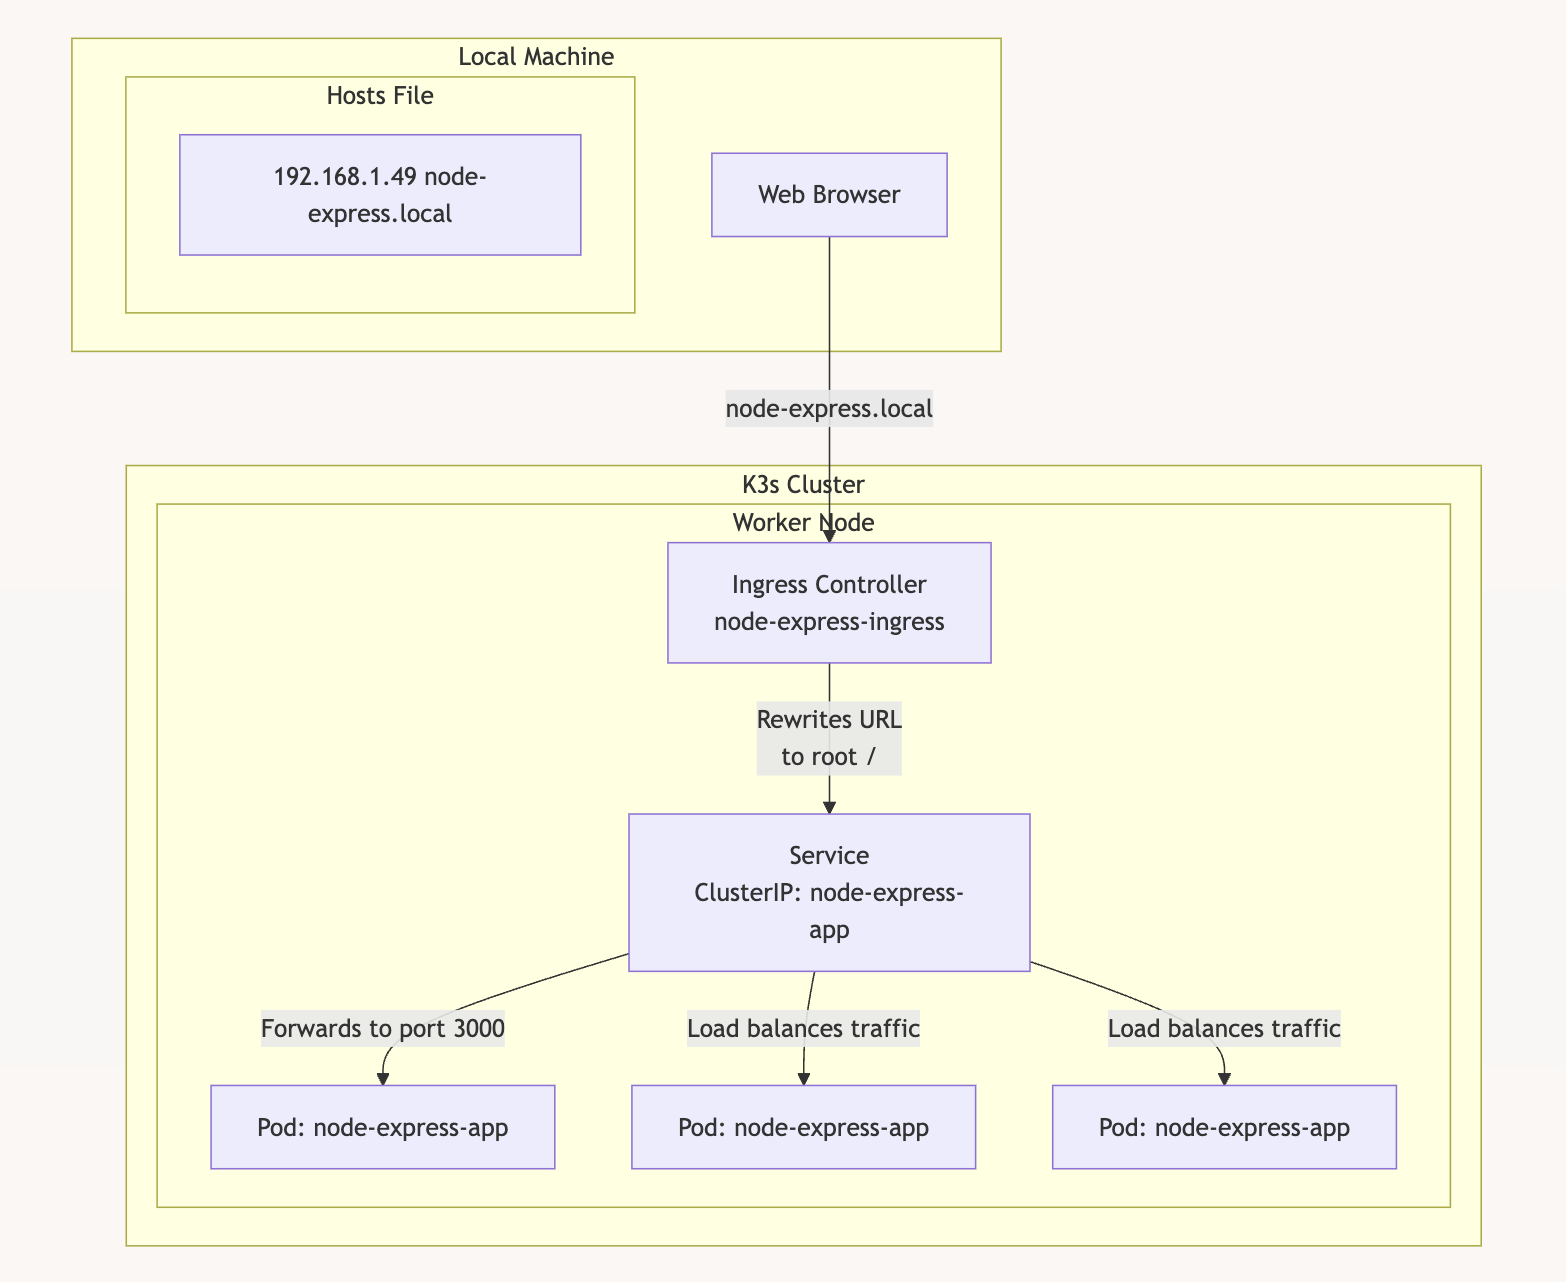
Set Hostname in Local System
Add to /etc/hosts:
192.168.1.49 node-express.local
Here’s a diagram of the setup
Handling Worker Node Connectivity Issues
Verify Node Status
kubectl get nodes
If workernode shows NotReady, check connectivity:
curl -k https://<MASTER-IP>:6443
Expected output:
{
  "status": "Failure",
  "message": "Unauthorized",
  "reason": "Unauthorized",
  "code": 401
}
Troubleshoot Worker Token
Verify the token:
cat /var/lib/rancher/k3s/server/token
Re-set the token:
echo "THE_TOKEN" | tee /var/lib/rancher/k3s/agent/token
Restart K3s Agent
sudo systemctl daemon-reload
sudo systemctl restart k3s-agent.service
Check Nodes
kubectl get nodes
Restarting K3s Service
Common Errors
- Port 6444 already in use:
sudo lsof -i :6444 kill -9 <PID> - Invalid server token:
Ensure the correct token is in:
/var/lib/rancher/k3s/server/token
Restart K3s
sudo systemctl restart k3s
Kubernetes Crash Handling
Kubernetes automatically restarts failed pods.
Check Pod Status:
kubectl get pods
Example output:
NAME                                READY   STATUS    RESTARTS   AGE
node-express-app-8477686cf7-6fmvz   1/1     Running   0          30m
If a pod crashes, Kubernetes will reschedule it to maintain the desired replica count.
Resolving Proxmox Update Errors: A Guide for Home Labs
proxmox Error: command 'apt-get update' failed: exit code 100
Many home lab users encounter update errors in Proxmox VE due to the default configuration including enterprise repositories. These repositories require a paid subscription, leading to « unauthorized IP » errors when attempting updates without one. This article provides a step-by-step guide to resolve this issue by switching to the community (no-subscription) repositories.
Understanding the Problem
Proxmox VE, by default, includes enterprise repositories in its configuration. These repositories provide access to features and updates intended for production environments and require a valid subscription. When a user without a subscription attempts to update their Proxmox installation, the system tries to access these restricted repositories, resulting in errors and failed updates.
The Solution: Switching to Community Repositories
The solution is to disable the enterprise repository and enable the community (no-subscription) repository. Here’s how:
- Access the Proxmox Web UI: Log in to the web interface of your Proxmox server.
-
Navigate to Repositories:
- Go to « Datacenter » and select your Proxmox node.
- Click on « Repositories ».
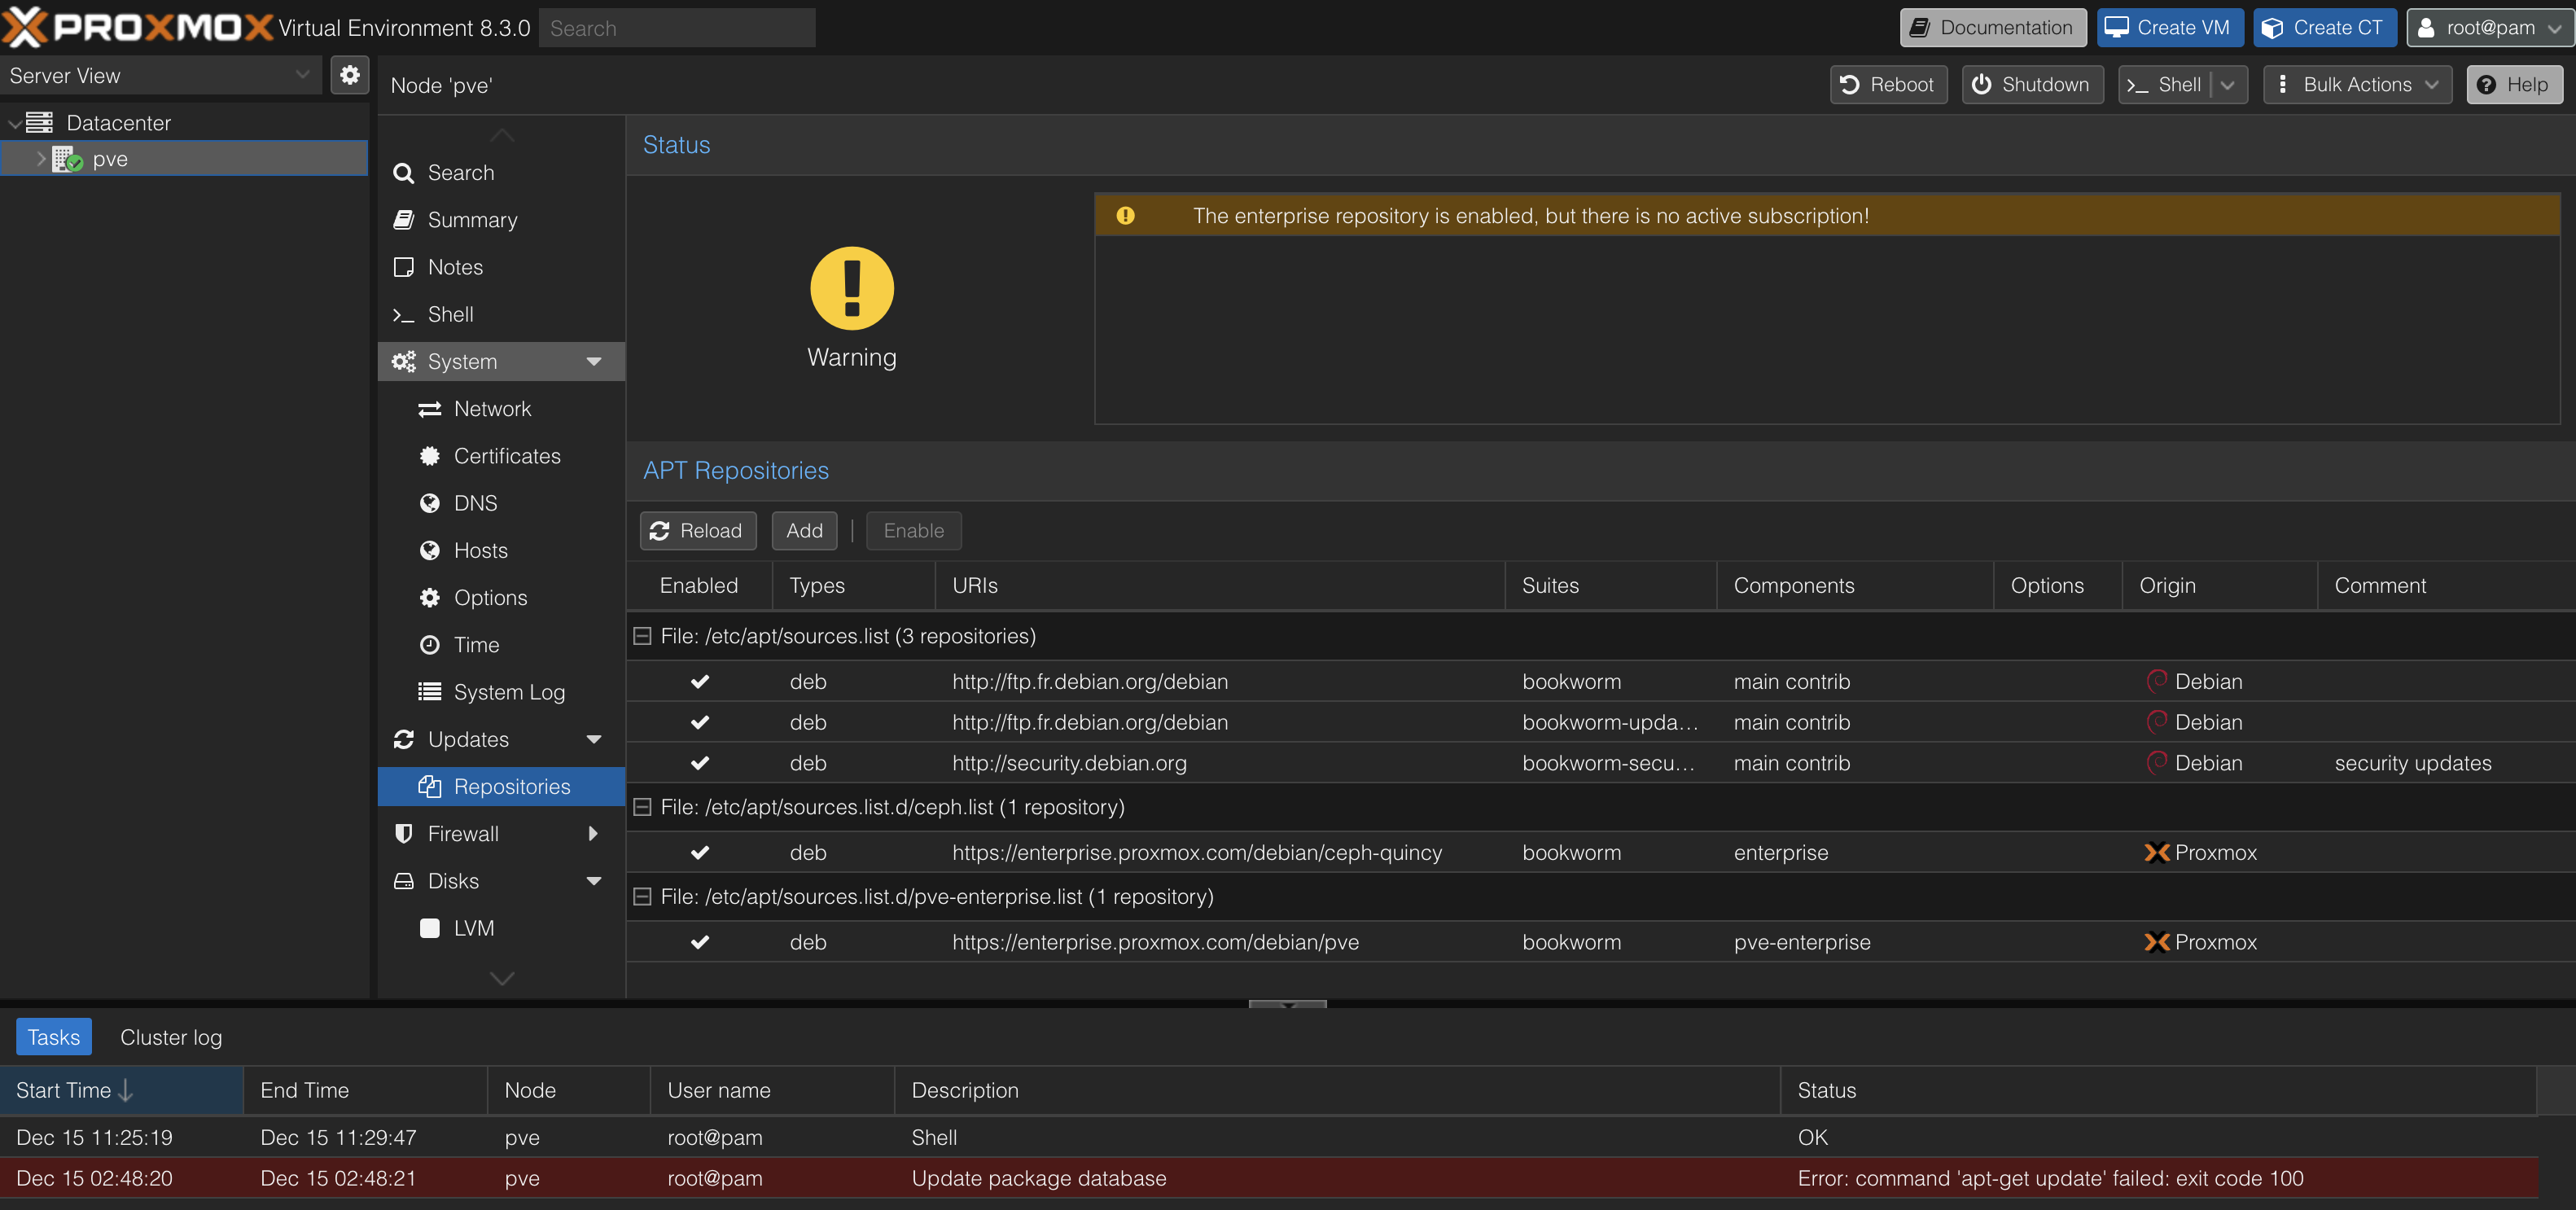
- Disable the Enterprise Repository:
- Locate the enterprise repository in the list (it will likely have a name indicating it requires a subscription).
- Click the « Disable » button next to it.
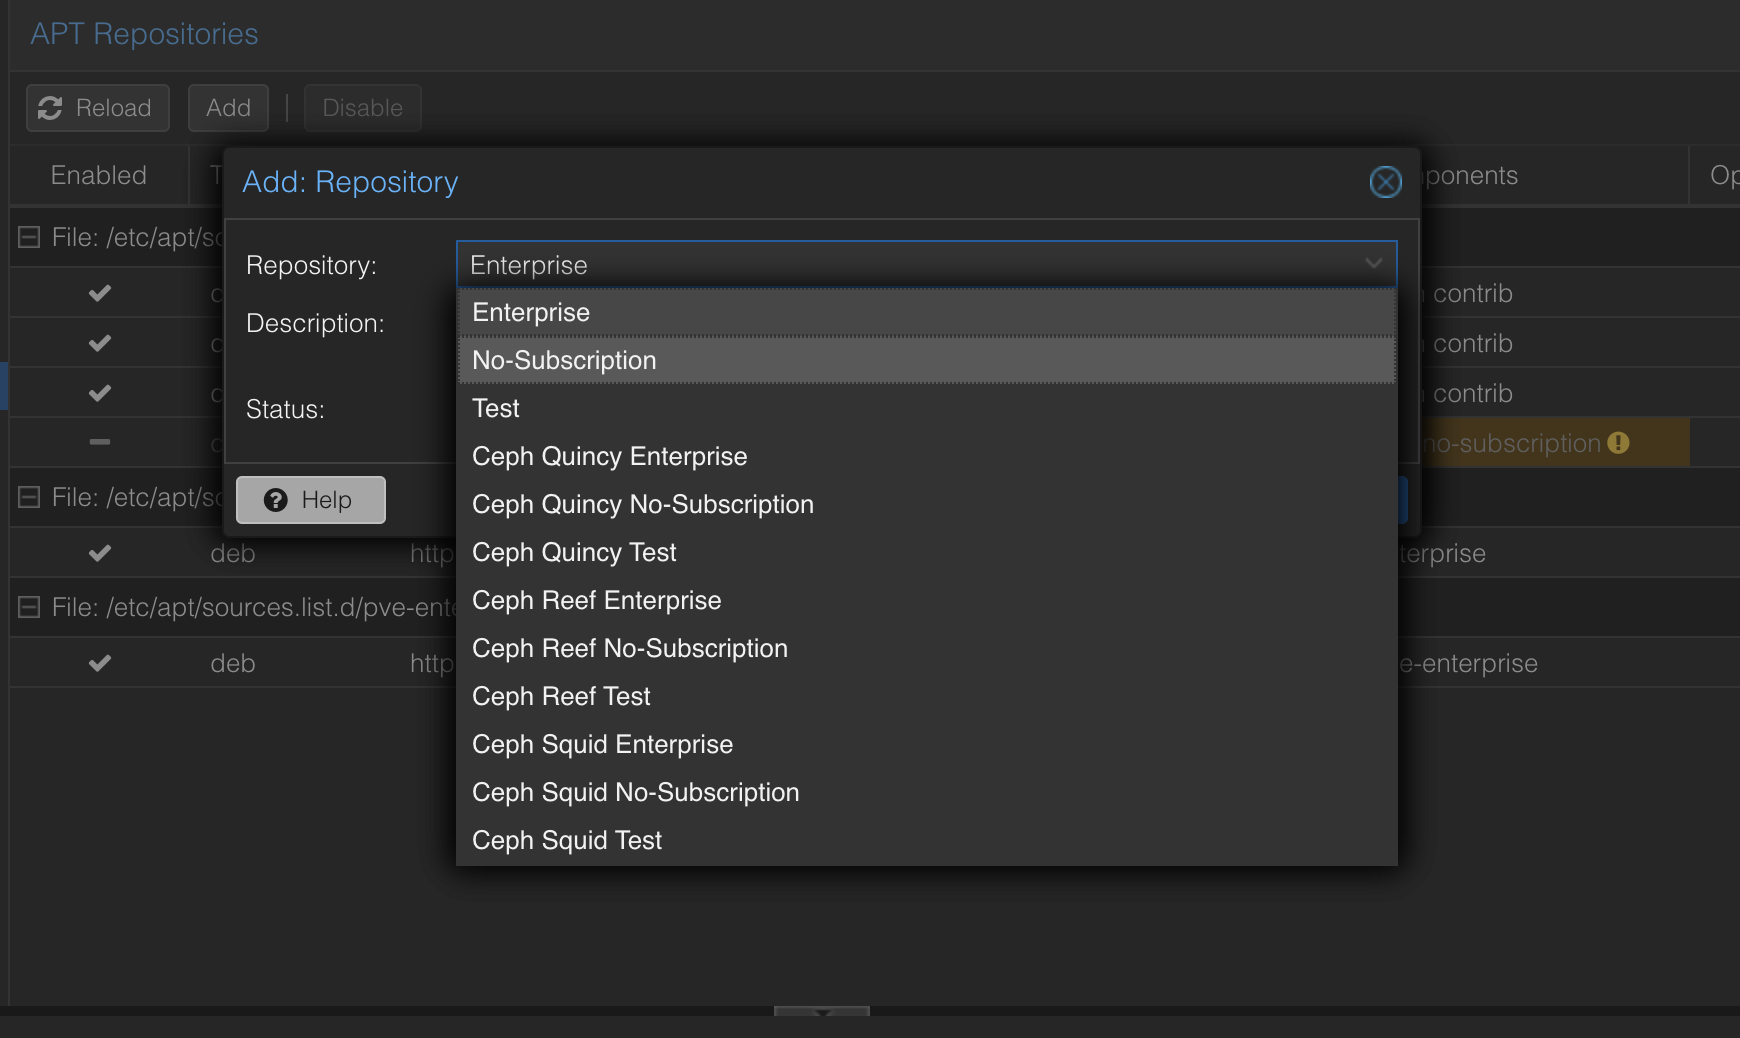
- Add the No-Subscription Repository:
- Click the « Add » button.
- In the pop-up window, select « No-Subscription » from the dropdown menu.
- Click « Add » to add the repository, then click « Enable » to activate it.
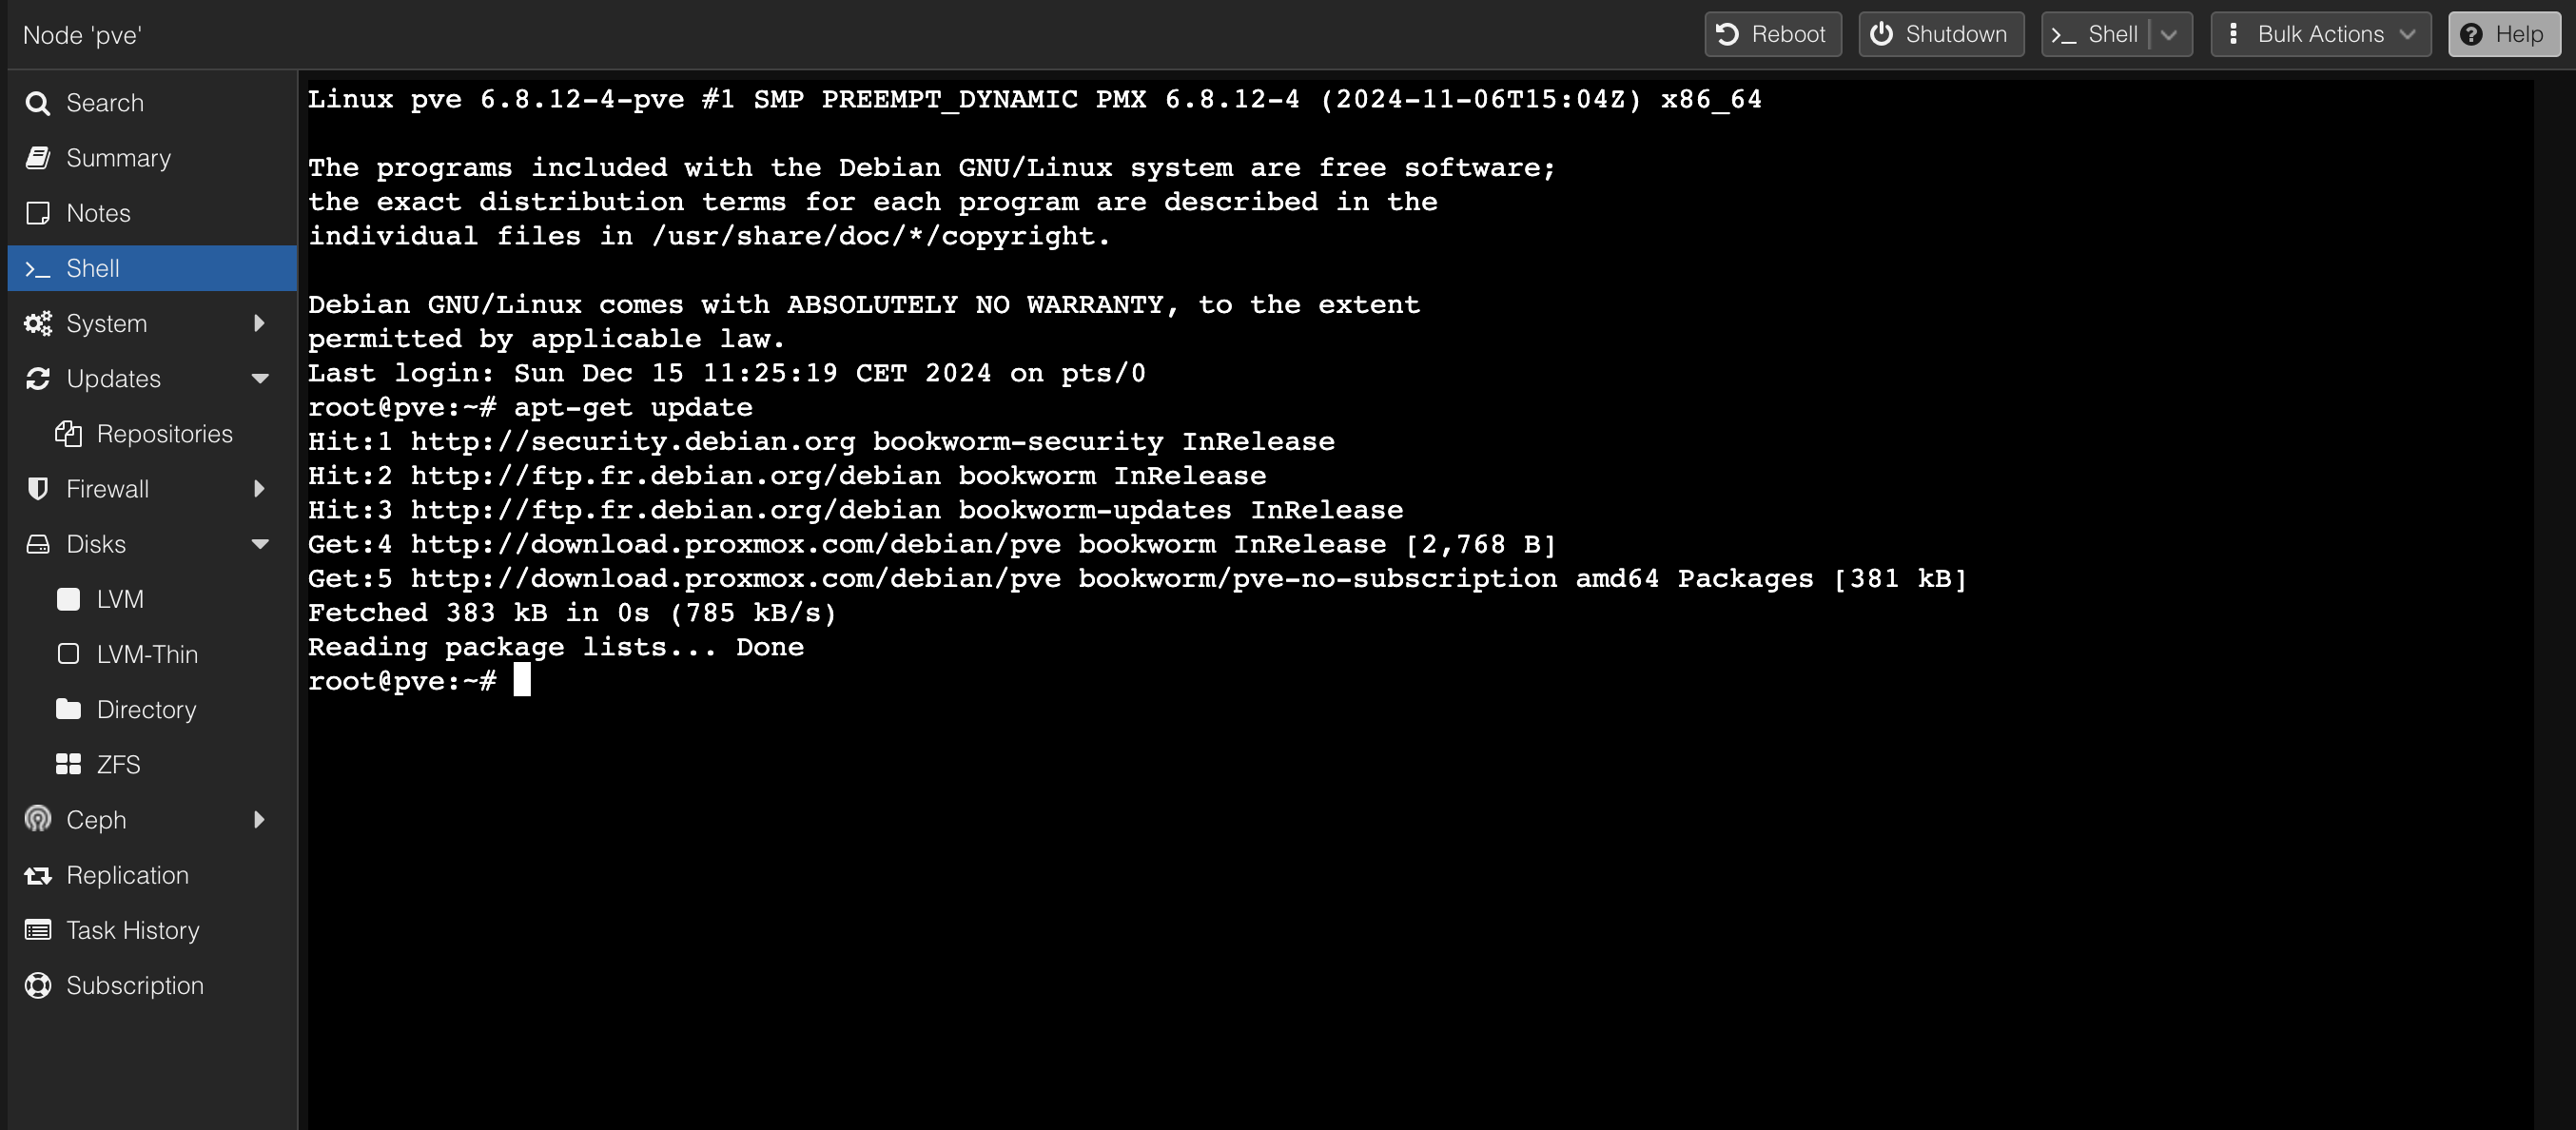
- Refresh Updates:
- Go to « Updates » and click the « Refresh » button. This will force Proxmox to update its package list from the newly enabled community repository.
Important Considerations
- Login Prompt: Even after disabling the enterprise repository, you might still see a login prompt related to subscriptions. This is a known quirk and generally doesn’t affect updates from the community repository. You can safely ignore it.
- Suitability: The no-subscription repository is perfectly suitable for home lab environments. However, it’s crucial to understand that it might not offer the same level of support or features as the enterprise repositories. For production environments, a valid subscription is highly recommended.
Conclusion
By following these steps, you can easily resolve Proxmox update errors in your home lab environment without requiring a paid subscription. This allows you to keep your Proxmox installation up-to-date with the latest community-supported packages and features.
In the Proxmox terminal:
Install ethtool
run
apt install ethtool -y
List the IP Addresses
ip addr
Search for your network card; in my case:
2: eno1: <BROADCAST,MULTICAST,UP,LOWER_UP> mtu 1500 qdisc pfifo_fast master vmbr0 state UP group default qlen 1000
    link/ether 9c:7b:ef:b5:bd:c1 brd ff:ff:ff:ff:ff:ff
    altname enp5s0f0
Get the network card id in my case eno1
Verify if Wake on LAN is Enabled
Run
ethtool <network card id>
So in my case
ethtool eno1
This should return:
Settings for eno1:
        Supported ports: [ TP    MII ]
        Supported link modes:   10baseT/Half 10baseT/Full
                                100baseT/Half 100baseT/Full
                                1000baseT/Full
        Supported pause frame use: Symmetric Receive-only
        Supports auto-negotiation: Yes
        Supported FEC modes: Not reported
        Advertised link modes:  10baseT/Half 10baseT/Full
                                100baseT/Half 100baseT/Full
                                1000baseT/Full
        Advertised pause frame use: Symmetric Receive-only
        Advertised auto-negotiation: Yes
        Advertised FEC modes: Not reported
        Link partner advertised link modes:  10baseT/Half 10baseT/Full
                                             100baseT/Half 100baseT/Full
                                             1000baseT/Half 1000baseT/Full
        Link partner advertised pause frame use: No
        Link partner advertised auto-negotiation: Yes
        Link partner advertised FEC modes: Not reported
        Speed: 1000Mb/s
        Duplex: Full
        Auto-negotiation: on
        master-slave cfg: preferred slave
        master-slave status: slave
        Port: Twisted Pair
        PHYAD: 0
        Transceiver: external
        MDI-X: Unknown
        Supports Wake-on: pumbg
        Wake-on: g
        Link detected: yes
Look for
   Supports Wake-on: pumbg
        Wake-on: g
If you get pumbg This means that your network card supports Wake-on-LAN.
If you don’t have Wake-on: g it means the feature is currently disabled. To enable it, please run:
ethtool -s <network card id> wol g
In my case :
ethtool -s eno1 wol g
Persist the WOL even after a machine restart
It’s not impossible that what we have done will be erased by a restart in order to make that change persistent.
nano /etc/systemd/system/wol.service
Then put
[Unit]
Description=Enable Wake-on-LAN
After=network.target

[Service]
Type=oneshot
ExecStart=/usr/sbin/ethtool -s <network card id> wol g

[Install]
WantedBy=multi-user.target
So in my case :
[Unit]
Description=Enable Wake-on-LAN
After=network.target

[Service]
Type=oneshot
ExecStart=/usr/sbin/ethtool -s eno1  wol g

[Install]
WantedBy=multi-user.target
Then run to enable the file we created.
systemctl enable wol.service
and
systemctl start wol.service
Install a Wake-on-LAN Utility
To send a Wake-on-LAN (WoL) packet from a Mac, you can use a tool such as « wakeonlan. »
brew install wakeonlan
Then run
wakeonlan <mac_address_of_the_machine>
Something like
wakeonlan 3C:5B:JK:B1:ED:E9
WireGuard is a super simple and fast VPN. It’s built with modern encryption, so it’s secure, and it’s designed to be lightweight and easy to set up. Unlike older VPNs like OpenVPN or IPSec, WireGuard runs right in the Linux kernel, making it crazy fast and efficient. Whether you want to secure your internet traffic or connect devices, it gets the job done with minimal hassle.
Setting Up WireGuard with Docker Compose
You can deploy WireGuard easily using Docker Compose. Below is an example of a docker-compose.yml file. Modify it to suit your needs.
This configuration creates a WireGuard container that listens on UDP port 51820 and maps it to the container’s internal port 51820.
services:
  wireguard:
    image: lscr.io/linuxserver/wireguard:latest
    container_name: wireguard
    cap_add:
      - NET_ADMIN
      - SYS_MODULE
    environment:
      - PUID=1000
      - PGID=1000
      - TZ=Europe/Paris              # Set your timezone
      - SERVERURL=32.123.113.16    # Replace with your domain or public IP
      - SERVERPORT=51820
      - PEERS=1
      - PEERDNS=8.8.8.8
      - INTERNAL_SUBNET=10.13.13.0
      - ALLOWEDIPS=0.0.0.0/0
      - PERSISTENTKEEPALIVE_PEERS=
      - LOG_CONFS=true
    volumes:
      - ./config:/config
      - /lib/modules:/lib/modules
    ports:
      - 51820:51820/udp
    sysctls:
      - net.ipv4.conf.all.src_valid_mark=1
      - net.ipv4.ip_forward=1
    restart: unless-stopped
Once your docker-compose.yml file is ready, start the container with:
docker compose up -d
Checking the Configuration Files
After running the container, the WireGuard configuration files are stored in the ./config directory. To view the server configuration, use:
cat ./config/wg_confs/wg0.conf
You’ll see something like this:
[Interface]
Address = 10.13.13.1
ListenPort = 51820
PrivateKey = kDDjhdkPZpdpsKKsksdsdOOdjssksdI=
PostUp = iptables -A FORWARD -i %i -j ACCEPT; iptables -A FORWARD -o %i -j ACCEPT; iptables -t nat -A POSTROUTING -o eth+ -j MASQUERADE
PostDown = iptables -D FORWARD -i %i -j ACCEPT; iptables -D FORWARD -o %i -j ACCEPT; iptables -t nat -D POSTROUTING -o eth+ -j MASQUERADE

[Peer]
# peer1
PublicKey = cqkdqqdkqdknqdnqkdnqdkqdknqdnkdqnqdqdk=
PresharedKey = Ndqqdqdkoqdokdoqkokqdokdqokqd=
AllowedIPs = 10.13.13.2/32
Connecting a WireGuard Client
To connect a client to your WireGuard server, use the following configuration in your WireGuard client app:
[Interface]
PrivateKey = 8Ldqddqqddqoodododod4=  # The client-generated private key
ListenPort = 51820
Address = 10.13.13.2/32
DNS = 8.8.8.8

[Peer]
PublicKey = cqkdqqdkqdknqdnqkdnqdkqdknqdnkdqnqdqdk  # Public key from the server's wg0.conf [Peer] section
PresharedKey = Ndqqdqdkoqdokdoqkokqdokdqokqd=       # Preshared key from the server's wg0.conf [Peer] section
AllowedIPs = 0.0.0.0/0                              # Allowed IPs from the server's wg0.conf [Peer] section
Endpoint = 32.123.113.160:51820                    # Server public IP/domain and port
And that’s it! With this setup, you’ll have a fully functional WireGuard VPN server running in Docker, ready to secure your connections.
Having compressed images on a website is crucial for delivering a fast and seamless user experience. When images are optimized, web pages load faster, allowing users to navigate the site without delays, which is especially important for maintaining engagement and reducing bounce rates. A faster experience is better for your users, as it keeps them on the site longer and enhances their satisfaction. This is particularly important on mobile devices, where 4G and other connections can often be unstable or slow, causing unoptimized images to load slowly and frustrate users.
Additionally, compressing images can have a significant impact on your website’s egress costs and the environment. Reducing the overall size of a website means less data is transferred, which lowers bandwidth costs and energy usage. Websites that are lighter and faster are more efficient and eco-friendly, reducing the carbon footprint associated with hosting and delivering content across the web. By optimizing images, you’re not only improving the user experience but also contributing to a more sustainable internet.
Compress images which are part of your layout
Images that are part of a website’s layout are visual elements that form the design and structure of the site. These include:
- Logos: The brand’s identity, typically located in the header or footer.
- Banners and hero images: Large images at the top of pages used to grab attention.
- Icons: Small, functional images like social media icons, navigation icons, or feature highlights.
- Background images: Visuals used in the background of sections or entire pages to enhance the aesthetic appeal.
- Decorative images: Any other visuals embedded in the layout for design purposes, such as dividers, borders, or illustrations.
These images typically do not change often and remain consistent across multiple pages or sections of the website. They are different from content images (like product photos or blog images) that might be frequently updated.
Use Photoshop « Save for the Web »
Photoshop is a tool used by front-end developers and designers. Out of the box, the software comes with a handy feature to compress images.
To compress images with Photoshop, follow this process:
- First of all, open the images with Photoshop

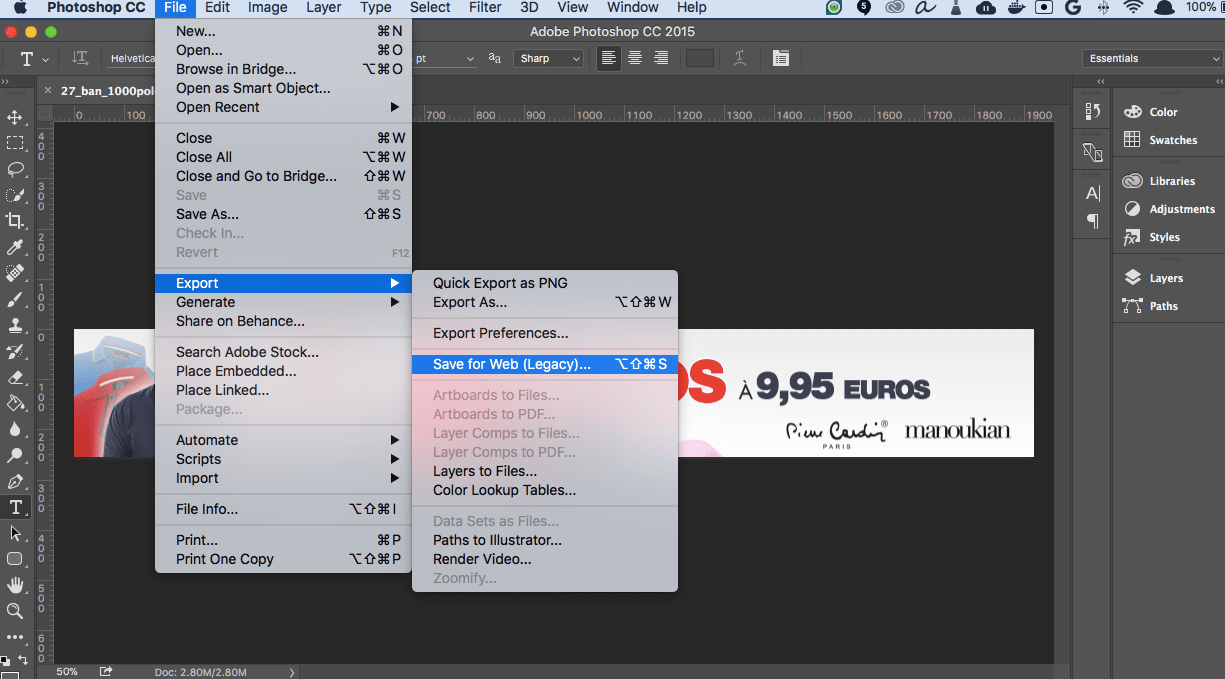
- Export the image:
Click on File -> Export -> Save for Web
)
- Handle the compression manually
Click on the 4-Up tab on the top left, this will display your image with 4 different compression settings.
)
On the bottom left, you have the possibility to zoom in on the image. I definitely recommend you zoom your image to see more precisely the image quality degradation.
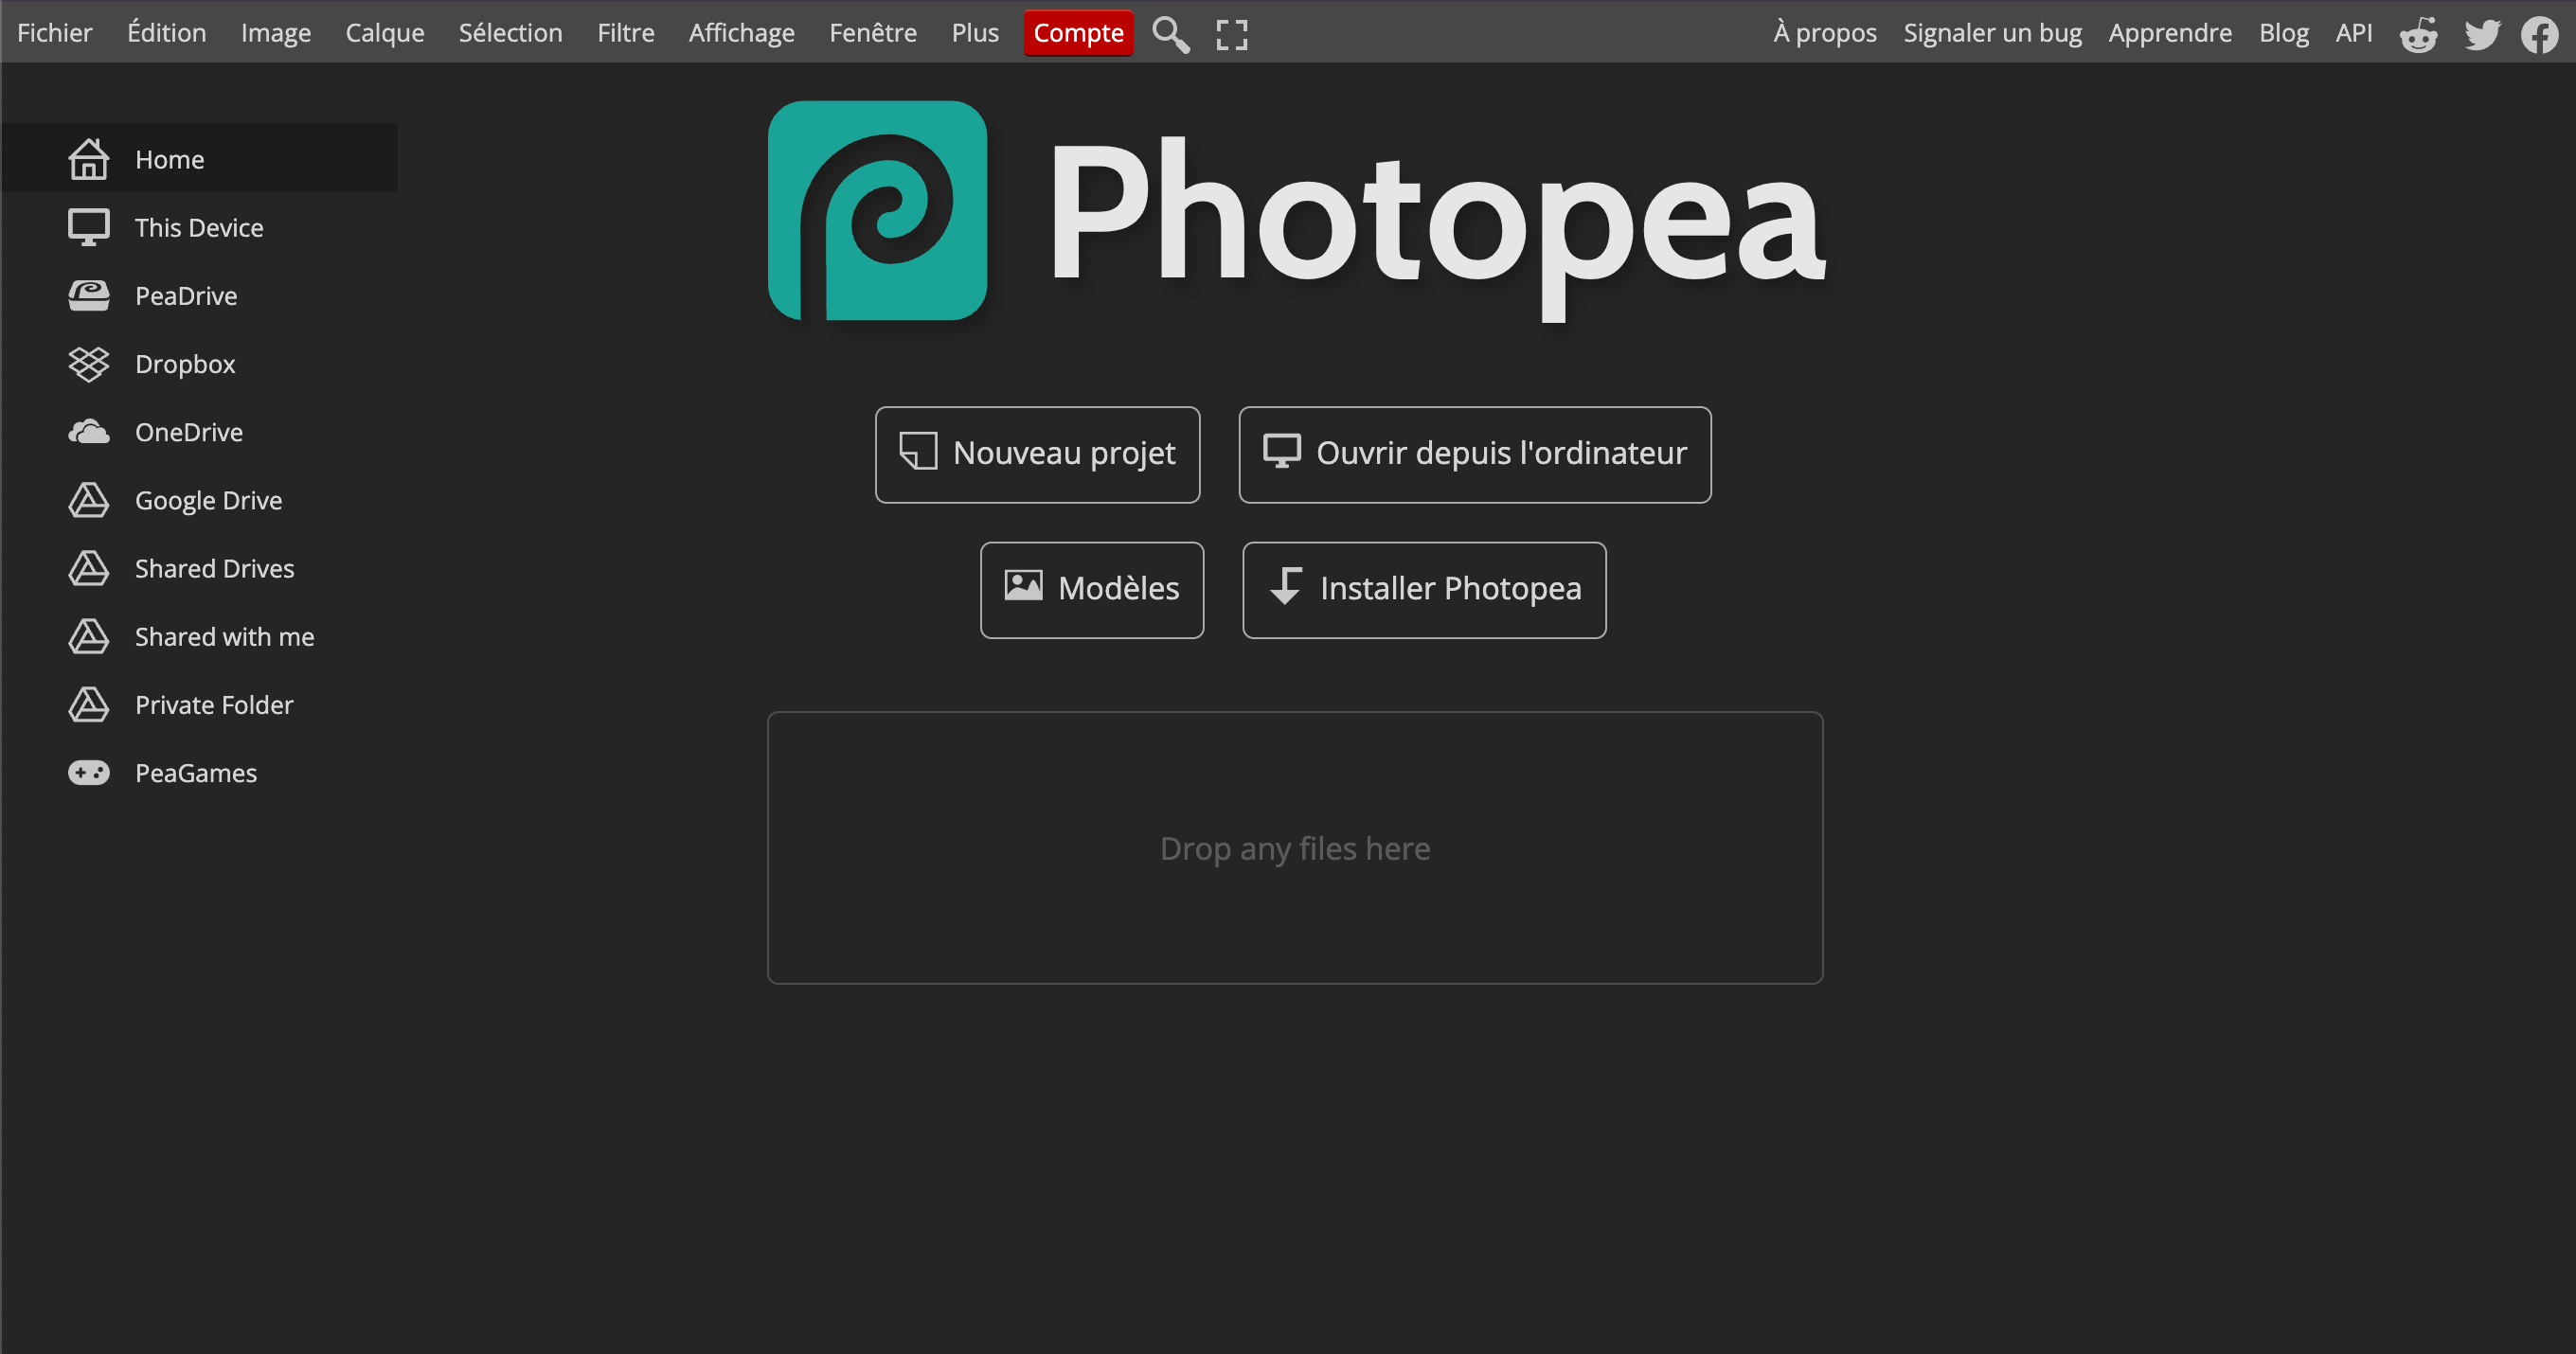
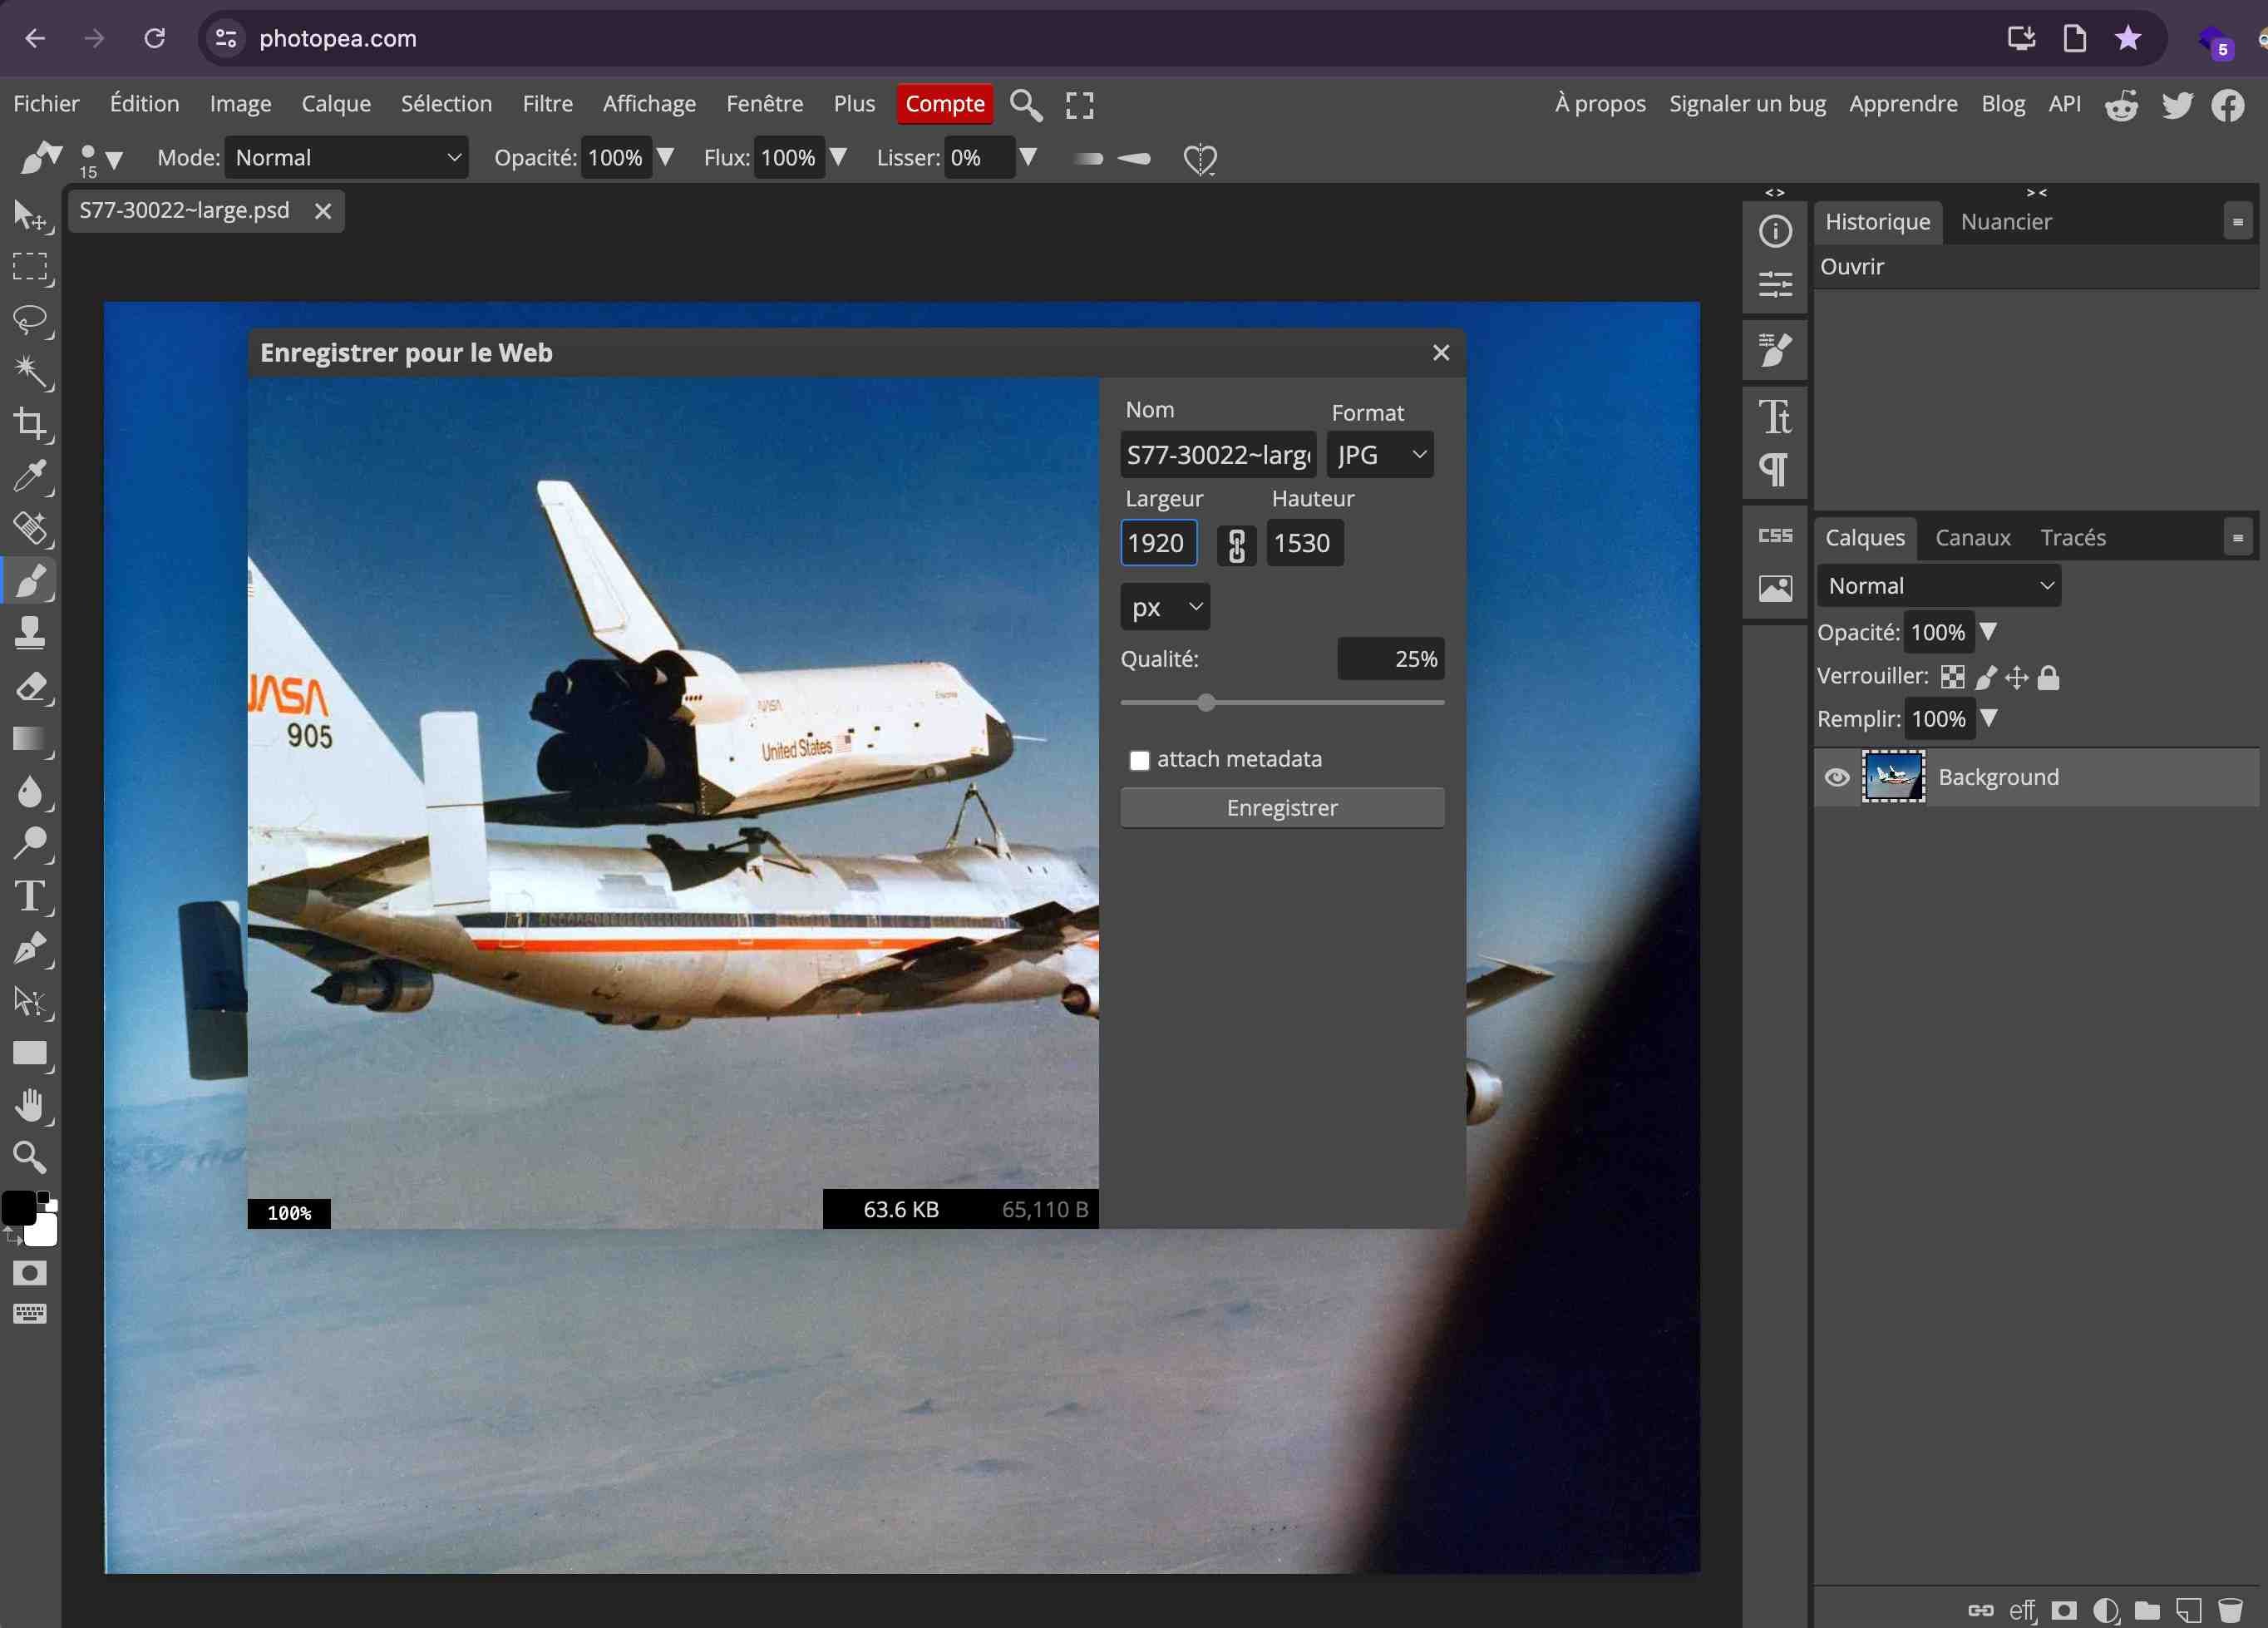
Alternatively, you can use the Photoshop online alternative: Photopea.
- Open the images with Photopea
- Export the image:

-
Tweak the compression manually
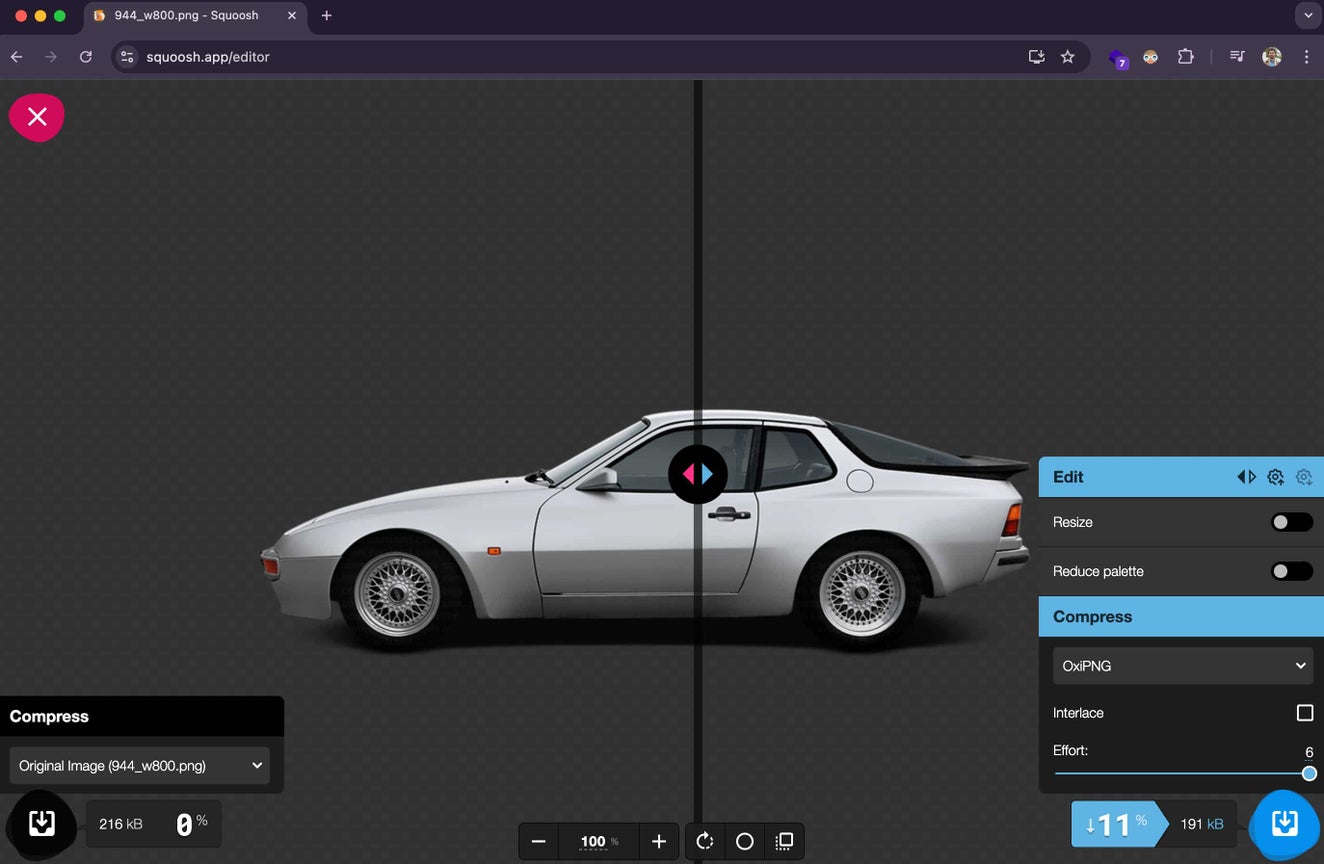
Squoosh.app
Squoosh is a powerful, web-based image compression tool developed by Google, allowing users to easily reduce image file sizes without sacrificing quality. It supports various image formats and offers real-time comparison between the original and compressed versions, along with advanced settings for resizing, format conversion, and optimizing images for the web. Squoosh runs entirely in the browser, making it fast, private, and highly accessible for quick image optimization tasks.
The usage of Squoosh is very straightforward. I’m not sure I need to guide you.
Optimize in bulk
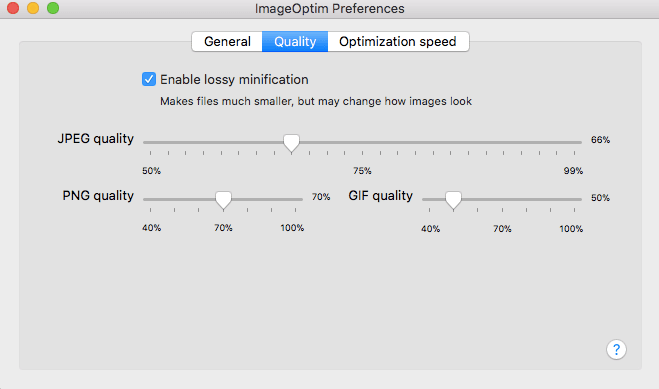
ImageOptim for Mac
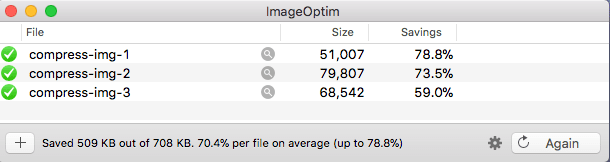
If you need to optimize a lot of images, I recommend ImageOptim. This tool is quite simple to use.
- Tweak the settings:
First, I recommend changing the quality settings. Don’t be afraid to try different settings to optimize the savings.
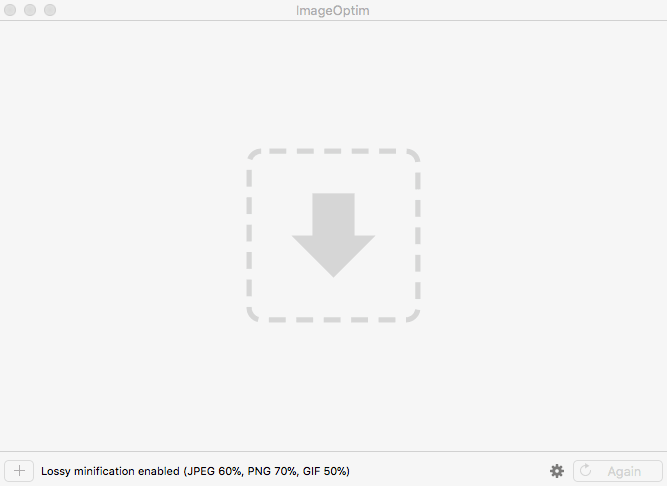
- Drop the images and wait for the compression to finish:
Optimize in bulk with the CLI
Optimize PNG
To optimize PNG in bulk, I recommend pngquant. Have a look at the documentation.
To install it:
apt-get install pngquant
Personally, I use this command:
pngquant --quality=60 --ext=.png --force *.png
This converts (overrides) the original image.
Optimize JPG
Mozjpeg is the perfect tool to optimize JPG on Linux. To install it, do the following:
sudo apt-get -y install build-essential cmake libtool autoconf automake m4 nasm pkg-config
sudo ldconfig /usr/lib
cd ~
wget https://github.com/mozilla/mozjpeg/archive/v3.1.tar.gz
cd mozjpeg-3.1/
autoreconf -fiv
mkdir build
cd build
sh ../configure
sudo make install
Move the binary executable (cjpeg) to your path:
cd /usr/local/bin
ln -s ~/mozjpeg-3.1/build/cjpeg
Start to optimize:
By default, the compression level is set to 75%.
cjpeg -outfile myImage.moz.jpg -optimise myImage.jpg
You can change the quality setting (here 50%):
cjpeg -quality 50 -outfile myImage.moz.jpg -optimise myImage.jpg
My advice is to try different quality levels to see what’s acceptable for you. Once you’ve found the right setting, you can optimize in bulk. There are plenty of ways to optimize in bulk, but I decided to create a simple Node.js script to do it.
Have a look at the documentation if you want to learn more about MozJpeg usage.
On the fly optimization with a service
There are various ways to perform on-the-fly optimization and resizing for your images. Most of the time, websites and apps will use cloud services to do this. In this article, I will present one self-hosted/open-source service and one managed service.
IPX image optimizer
IPX is a high-performance, secure, and easy-to-use image optimizer powered by the Sharp library and SVGO. It’s a project behind Nuxt Images and is used by Netlify. It’s pretty straightforward to use, but I will try to save you a bit of time by giving you my working configuration in the following lines.
Install IPX with Express
First of all start a new project with :
npm init -y
Then you are ready to install the packages :
npm install listhen express ipx
NB : It’s important to change the type in your package.json to "type": "module"
Create the main file for your server like :
touch app.js
Also create a public folder :
mkdir public
In your main file add the following :
import { listen } from "listhen";
import express from "express";
import {
  createIPX,
  ipxFSStorage,
  ipxHttpStorage,
  createIPXNodeServer,
} from "ipx";

const ipx = createIPX({
  storage: ipxFSStorage({ dir: "./public" }),
  httpStorage: ipxHttpStorage({ domains: ["origin-playground.antoinebrossault.com"] })
});

const app = express().use("/", createIPXNodeServer(ipx));

listen(app);
THe importannt part are along those lines :
const ipx = createIPX({
  storage: ipxFSStorage({ dir: "./public" }),
  httpStorage: ipxHttpStorage({ domains: ["origin-playground.antoinebrossault.com"] })
});
With storage: ipxFSStorage({ dir: "./public" }) IPX will optimize images stored in path of the app.
With httpStorage: ipxHttpStorage({ domains: ["origin-playground.antoinebrossault.com"] }) IPX will optimize images coming for a given domain.
How to use IPX ?
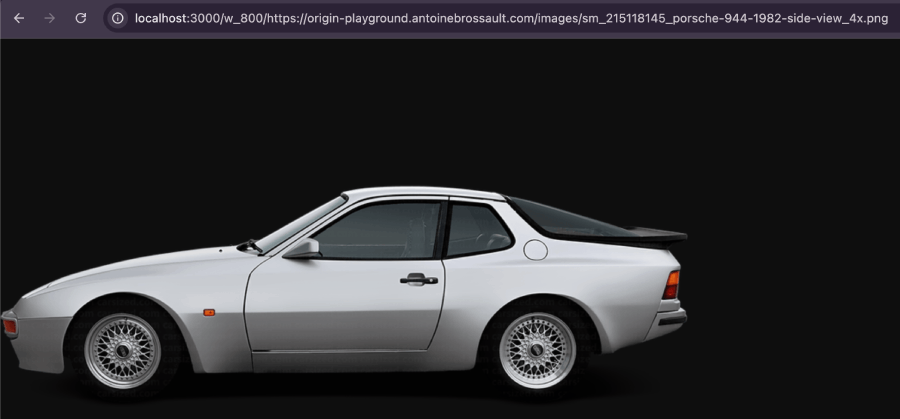
After your done configuring IPX you should be ready to optimize your images. Let’s start simple with a basic resize
Basic Resize :
Keep original format (png) and set width to 800:
/w_800/static/buffalo.png
Then we use
http://localhost:3000/w_800/https://origin-playground.antoinebrossault.com/images/sm_215118145_porsche-944-1982-side-view_4x.png
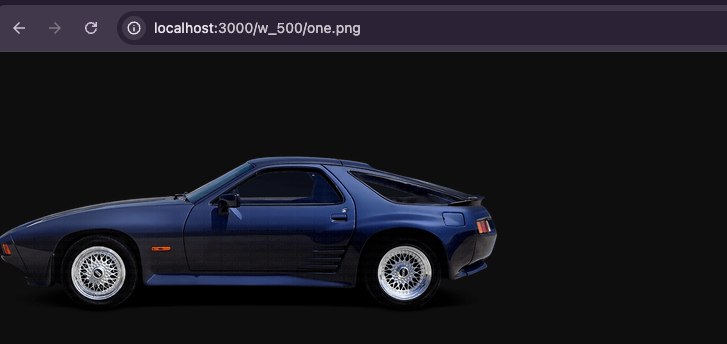
Basic Resize with a local image :
Assuming one.png is in our public folder /public/one.ong
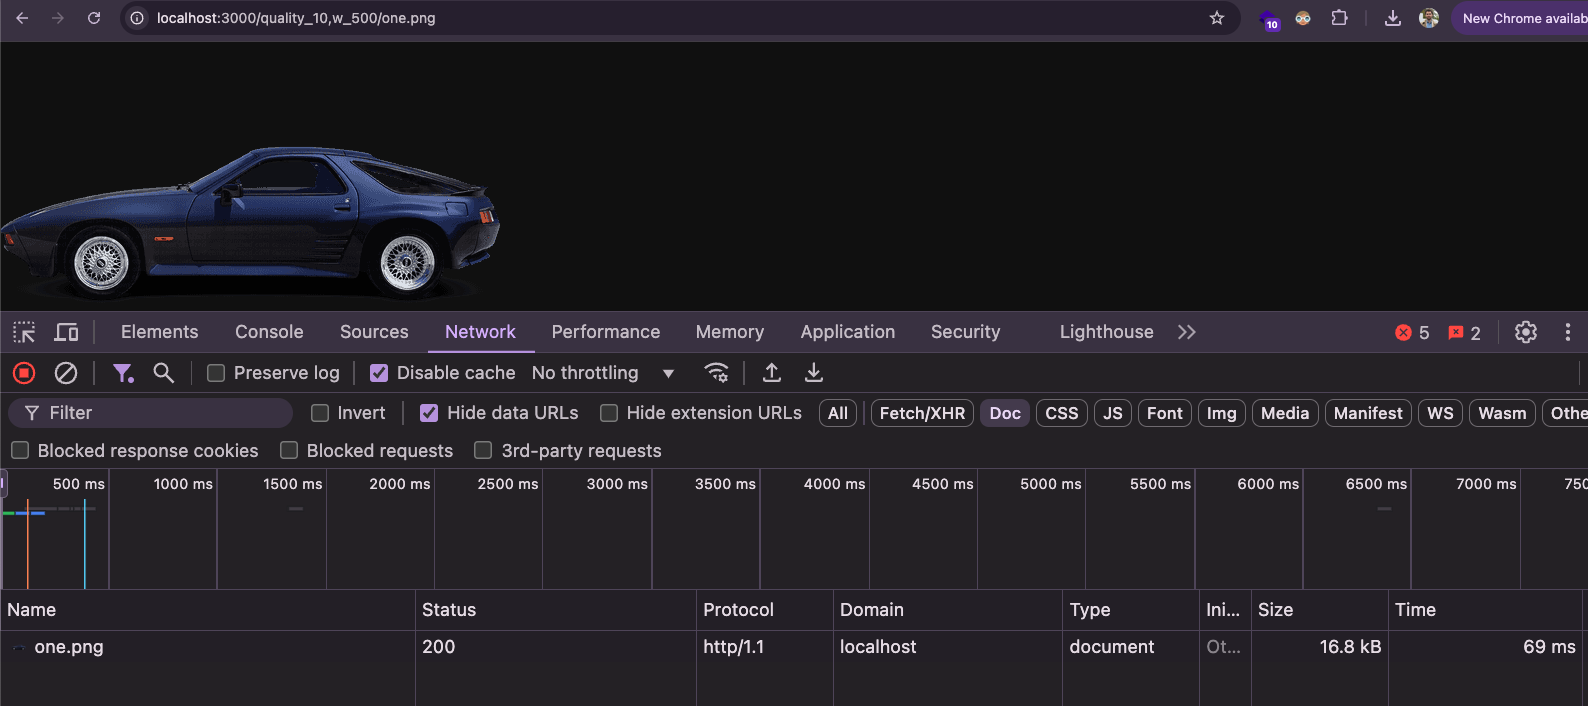
http://localhost:3000/W_500/one.png
Compression level at 80%:
http://localhost:3000/quality_80,w_500/one.png
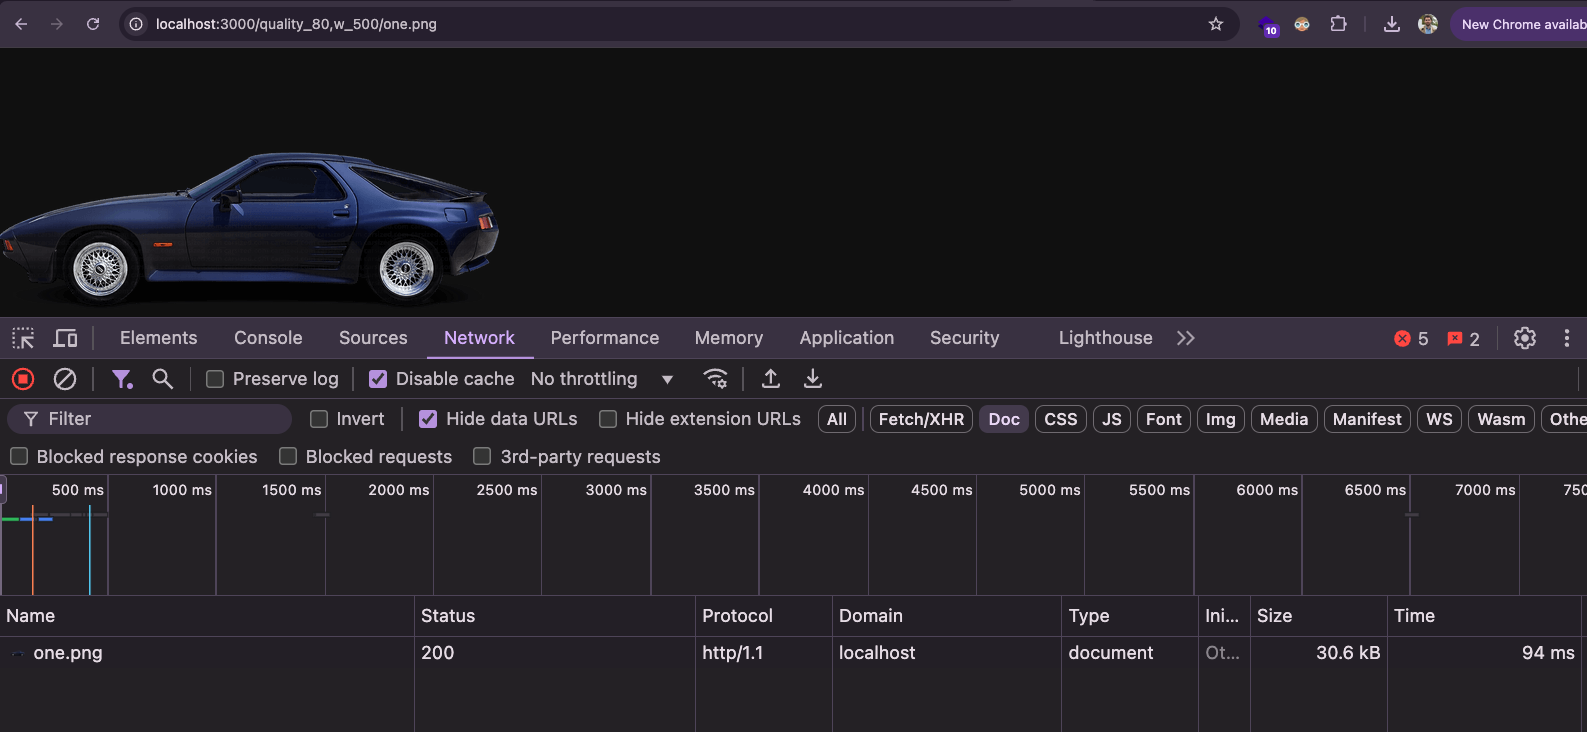
Compression level at 10%:
http://localhost:3000/quality_10,w_500/one.png
Comprehensive guide to image optimization
If you want to deep dive into image optimization, I recommend you have a look at images.guide by Addy Osmani.
For most developers it’s easier to scale images in CSS than to create other size versions of the images. So a lot of too big images are loaded on mobile and downscaled in CSS.Use Chrome Developers tools to spot desktop images on mobile
How to fix the big image issue ? Pure HTML approach :
Non optimized :
<img src='https://placeimg.com/800/400/tech' class='img-responsive img-center'>
Optimized :
In this example we provide multiple urls for the same image. The browser will pick a specific url depending on the width of the screen.
<img
  src="https://www.antoinebrossault.com/wp-content/uploads/2024/09/944_w800.png"
  media="(min-width: 320px) 300w, (min-width: 400px) 400w, (min-width: 640px) 600w, (min-width: 1000px) 800w"
  srcset="
  https://www.antoinebrossault.com/wp-content/uploads/2024/09/944_w300.png 300w,
  https://www.antoinebrossault.com/wp-content/uploads/2024/09/944_w400.png 400w,
  https://www.antoinebrossault.com/wp-content/uploads/2024/09/944_w600.png 600w,
  https://www.antoinebrossault.com/wp-content/uploads/2024/09/944_w800.png 800w"
  alt="" class="img-responsive img-center" />
Check this demo on codepen.
An alternative way to do it is to use the picture HTML tag, the srcset attribute allows an <img> element to specify multiple image sources of different resolutions, letting the browser choose the most appropriate one based on the screen size and pixel density. The
<img
  src="https://www.antoinebrossault.com/wp-content/uploads/2024/09/944_w800.png"
  media="(min-width: 300px) 300w, (min-width: 400px) 400w, (min-width: 640px) 600w, (min-width: 1000px) 800w"
  srcset="
  https://www.antoinebrossault.com/wp-content/uploads/2024/09/944_w300.png 300w,
  https://www.antoinebrossault.com/wp-content/uploads/2024/09/944_w400.png 400w,
  https://www.antoinebrossault.com/wp-content/uploads/2024/09/944_w600.png 600w,
  https://www.antoinebrossault.com/wp-content/uploads/2024/09/944_w800.png 800w"
  alt="" class="img-responsive img-center" />
If you want to force the browser to display a specific image based on the size, use the <picture> element; otherwise, use the srcset attribute.
Check this demo on codepen.
How to generate different image sizes?
Jimp
You can use Jimp to generate images with node.js:
Jimp is an image processing library for Node.js that allows users to manipulate images, such as resizing, cropping, and applying filters, directly in JavaScript. It supports a wide range of image formats and offers asynchronous methods for handling image processing tasks efficiently.
Here’s a basic usage of Jimp :
const Jimp = require('jimp');
const fs = require('fs');
// our images are in the ./images directory
const directory = "./images";
const imgs = fs.readdirSync(directory);

(async () => {

    for (let img of imgs) {

        const newImg = await Jimp.read(`${directory}/${img}`);

        await newImg.resize(200, 100);

        await newImg.write(`${directory}/${img}.min.jpg`);
    }

})();
Ipx
IPX is an image proxy library for Node.js that allows for dynamic image optimization and transformation, such as resizing, cropping, and format conversion, on the fly. It’s often used in conjunction with frameworks like Nuxt.js to deliver optimized images based on request parameters, improving performance and responsiveness for web applications.
Here’s an example with Express that give you a service to transform images on the fly :
First you need to install the following libraries :
npm install express ipx listhen
Create a file called app.js
// app.js
import { listen } from "listhen";
import express from "express";
import {
  createIPX,
  ipxFSStorage,
  ipxHttpStorage,
  createIPXNodeServer,
} from "ipx";

const ipx = createIPX({
  storage: ipxFSStorage({ dir: "./public" }),
  httpStorage: ipxHttpStorage({ domains: ["origin-playground.antoinebrossault.com"] })
});

const app = express().use("/", createIPXNodeServer(ipx));

listen(app);
Then run node app.js, and you will have your on-the-fly image optimization service ready.
Then, if you run the following HTTP call, the image hosted on origin-playground.antoinebrossault.com will be scaled down to a width of 800px. More option to discover on the project repo
http://localhost:3001/w_800/https://origin-playground.antoinebrossault.com/images/sm_215118145_porsche-944-1982-side-view_4x.png
How to fix the big image issue? Pure CSS approach:
Another technique is to use CSS rules only (background-images & media queries).
Non-optimized:
.my-bg{
    background-image: url(http://lorempicsum.com/futurama/1200/600/3);
    height: 600px;
    width: 1200px;
    max-width: 100%;
    background-repeat: no-repeat;
    display: block;
    margin: auto;
}
Optimized:
.my-bg{
    background-image: url(http://lorempicsum.com/futurama/1200/600/3);
    height: 600px;
    width: 1200px;
    max-width: 100%;
    background-repeat: no-repeat;
    display: block;
    margin: auto;
}

/* We add another URL for devices under 768px */
@media only screen and (max-width: 768px){
    .my-bg{
        background-image: url(http://lorempicsum.com/futurama/768/200/3);
    }
}
Pitfalls
NB: Some phones need bigger images due to the « device pixel ratio ». With srcset the browser will decide which version to display based on the context (e.g., retina display). If you want more control, use the <picture> element.
<img
  src="https://placeimg.com/800/400/tech"
  media="(min-width: 320px) 300w, (min-width: 400px) 400w, (min-width: 640px) 600w, (min-width: 1000px) 800w"
  srcset="
  https://placeimg.com/300/200/tech 300w,
  https://placeimg.com/400/300/tech 400w,
  https://placeimg.com/600/400/tech 600w,
  https://placeimg.com/800/400/tech 800w"
  alt=""
  class="img-responsive img-center"
/>
For example, if we take the code above: on a 400×736 px smartphone with a DPR (device pixel ratio), the image that will be loaded is the 450×400.

On the same screen size (400×736) but with a DPR of 2, the image that will be loaded is the 1200×800.

By default JavaScript files are blocking. They create a blank screen during their loading is loaded in the head of the page without any optimization.
How to check if the website contains blocking JavaScript?
Test the website on PageSpeedInsight and look for this warning “Eliminate render-blocking JavaScript in above-the-fold content”. The tool will list the blocking files but I recommend you to double-check in the source code. To do so, look for JavaScript files loaded at the top of the page that don’t contain any defer or async attributes.
How to fix?
There are a couple of ways to fix this issue. One of the best methods is to place the scripts at the bottom of the page and add a defer attribute.
Non-optimized:
<script type='text/javascript' src='./app.js?ver=1.10.1'></script>
Optimized:
<script type='text/javascript' src='./app.js?ver=1.10.1' defer></script>
You may want to use the async attribute, which does almost the same thing except that defer will preserve the execution order.
Use async if your script doesn’t depend on any other scripts (like Google Maps SDK); otherwise, use defer.
NB: If you see defer and async used together, it’s because this was a technique for browsers that did not support defer. Nowadays ALL browsers support defer.
Pitfalls
Most of the time, developers know that loading a script in the head is a bad practice, but sometimes they feel forced to do it.
Common pitfall: Inline JavaScript in the HTML
JavaScript can be executed in an external file but also inside the HTML between two script tags. If you decide to move some JavaScript files from the top to the bottom and add a defer attribute, the website can break because of unsatisfied function definitions due to inline JavaScript.
How to fix that?
There’s a way to defer inline JavaScript by using this piece of code:
window.addEventListener("DOMContentLoaded", () => {
  const scripts = document.querySelectorAll("script[type='defer']");

  scripts.forEach(script => {
    try {
      eval(script.innerHTML);
    } catch (error) {
      if (error instanceof SyntaxError) {
        console.error('[ERROR]', error);
      }
    }
  });
});
This code will defer the inline JavaScript and wait for all the scripts to be loaded and executed before executing inline scripts.
Example
<h1>Hello</h1>

<script defer src='./jQuery.js'></script>

<script>
   $(document).ready(() => { $('h1').append(' world !'); });
</script>
This example will generate an error because we call the $ function before it’s defined due to the defer attribute (the $ function is defined in jQuery.js).
Example
<h1>Hello</h1>

<script type="defer">
  // jQuery code transformed using vanilla JS and ES7 features
  document.addEventListener('DOMContentLoaded', () => {
    document.querySelector('h1').insertAdjacentHTML('beforeend', ' world !');
  });
</script>

<script defer src='./jQuery.js'></script>

<script>
// Code snippet rewritten in modern ES7+ syntax
window.addEventListener('DOMContentLoaded', () => {
  const deferredScripts = document.querySelectorAll("script[type='defer']");

  deferredScripts.forEach(script => {
    try {
      eval(script.innerHTML);
    } catch (error) {
      if (error instanceof SyntaxError) {
        console.error('[ERROR]', error);
      }
    }
  });
});
</script>
This example will work because we wait for the $ function to be defined before executing the code.
- We add the attribute
type="defer"to the inline JavaScript script. - We add the code snippet mentioned above.
When all the scripts are executed, the code will replace our custom inline scripts with standard scripts.
Common pitfall: One of the blocking scripts is an A/B testing script
If one of the blocking scripts is an A/B testing script (ABtasty / Optimizely / Kameloon / Maxymiser, etc.), it’s normal for this script to block the page; otherwise, it will create a flickering effect.
How to fix that?
- Don’t load the script on mobile if no mobile tests are running.
- Load the script only on pages where tests are running (a small test on the backend will work).
TTFB measures the duration from the user or client making an HTTP request to the first byte of the page being received by the client’s browser
In this step, the server can perform different tasks, like requesting data from a database, calling a web-service, or calculating results…
How to check the Time To First Byte?
- Go to https://WebPageTest.orgi
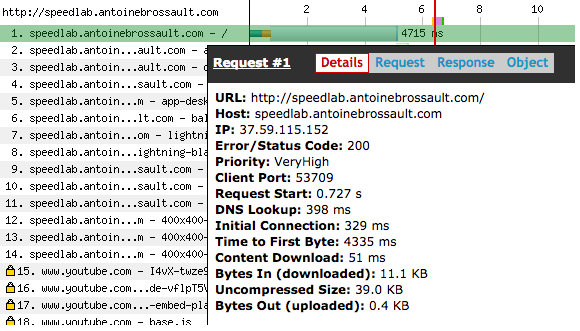
In this example, we can see that the TTFB is 4335 ms, which indicates a TTFB issue. Pay attention to the color of the bar. If the bar contains a majority of blue sky, it’s a TTFB issue, but if the bar is mainly dark blue, it’s a content download issue.
In this example, the content download took 4188 ms. The usual suspects for this issue are a bloated HTML response and/or a Gzip issue.
Quickly check the Time To First Byte with CURL
If you’re in a rush or want to quickly check the Time To First Byte, you can use this command:
curl -s -L -o /dev/null -w "
    HTTP code : %{http_code} \n
    Number of Redirects : %{num_redirects} \n
    Last url : %{url_effective}  \n
    Look up time : %{time_namelookup} \n
    Connect: %{time_connect}  \n
    TTFB: %{time_starttransfer}  \n
    ? Total time: %{time_total} \n \n" https://google.fr
NB: Run this command more than once to avoid uncached side effects.
How to fix a TTFB issue?
-
Check for Uncached Database Requests: Identify if the website makes uncached database requests or calls to a web service on the server-side. Uncached requests can lead to performance bottlenecks, especially under high load.
-
Implement Object Caching with Redis or Memcached: Use Redis or Memcached to cache frequently accessed data and objects (e.g., user sessions, frequently accessed queries). This reduces the need for repetitive database queries and improves response times.
-
Database Query Caching: Enable query caching if your database supports it (e.g., MySQL’s query cache). Cached queries can significantly speed up repeated requests by storing the results of frequently executed queries.
-
Use a Reverse Proxy Cache: Deploy reverse proxy caching solutions like Varnish or Nginx. These tools cache the responses from your backend and can serve them quickly without hitting the application server for every request.
-
Optimize Database Indexing: Ensure that your database tables are properly indexed. Indexing speeds up query execution and retrieval times, reducing the need for extensive data scanning.
-
Database Connection Pooling: Implement database connection pooling to reuse existing database connections instead of creating new ones for each request. This reduces connection overhead and improves performance.
-
Optimize Backend Code and Queries: Review and optimize backend code and SQL queries for efficiency. Look for slow queries and refactor them to reduce execution time and resource usage.
-
Use Asynchronous Processing: If your site makes a synchronous call to a web-service, try to cache the web-service response. If it’s not possible to cache the web-service response, try calling the web-service from the front end by making an asynchronous AJAX request. In other words, load the website’s layout first and load the web-service data afterward (e.g., demo on Amazon.co.uk | demo on Github.com).
Minio Server (Port 9000)
The service running on port 9000 is the primary Minio server. This is the main entry point for interacting with the Minio object storage system. Here are its key functions:
- Object Storage Service: This is where you can upload, download, and manage your objects (files) in the Minio storage.
- S3-Compatible API: Minio server provides an S3-compatible API, allowing you to interact with it using standard S3 client tools and libraries.
To secure it with Apache2 and let’s encrypt
bitnami/minio:latest 0.0.0.0:32771->9000/tcp, :::32771->9000/tcp, 0.0.0.0:32768->9001/tcp, :::32768->9001/tcp
<IfModule mod_ssl.c>
<VirtualHost *:443>
    ServerAdmin webmaster@myS3.faast.life
    ServerName myS3.faast.life

    # ProxyPass for Node.js application
    ProxyPass / http://localhost:32771/
    ProxyPassReverse / http://localhost:32771/

    DocumentRoot /home/antoine/automation
    ErrorLog /var/log/apache2/.log
    CustomLog /var/log/apache2/.log combined

    <Directory /home/antoine/automation>
        Options Indexes FollowSymLinks
        AllowOverride All
        Require all granted
    </Directory>

ServerAlias mys3.faast.life
SSLCertificateFile /etc/letsencrypt/live/mys3.faast.life/fullchain.pem
SSLCertificateKeyFile /etc/letsencrypt/live/mys3.faast.life/privkey.pem
Include /etc/letsencrypt/options-ssl-apache.conf
</VirtualHost>
</IfModule>
⚠️ heads-up : Accessing `https://mys3.faast.life/` will redirect you to localhost, but if you use a valid path, you will hit the requested resource.
Then I can access a public bucket with the following url :
<scheme> <host> <path>

<https://>  <mys3.faast.life> </public-site/index.html>
That I can access :
https://mys3.faast.life/public-site/index.html
Minio Console (Port 9001)
The service on port 9001 is the Minio Console, a separate component introduced in newer versions of Minio for enhanced administration and monitoring. Here are its main functions:
- Management Dashboard: The Minio Console offers a more advanced and user-friendly web interface for administrators. It provides dashboards and graphical representations of various metrics.
- Monitoring and Alerts: You can monitor the health, performance, and usage of your Minio deployment through the console. It also supports setting up alerts for different events.
-User Management: The console facilitates easier management of users and access policies.
Configuration Management: Allows for more straightforward configuration of Minio server settings and cluster management tasks.
Here’s the Apache2 configuration for the control plane. In another article on this website, I covered how I managed the web socket redirect to make the Minio file browser work with Apache2.
Below is the Apache2 configuration I used to secure the control plane/console. To obtain the certificate, I use an automation script I created earlier, which I discussed in this article.
With this configuration, your Minio container is secured and properly integrated with Apache2.
bitnami/minio:latest 0.0.0.0:32771->9000/tcp, :::32771->9000/tcp, 0.0.0.0:32768->9001/tcp, :::32768->9001/tcp
To secure it with Apache2 and let’s encrypt
<IfModule mod_ssl.c>
<VirtualHost *:443>
    ServerAdmin webmaster@s3.faast.life
    ServerName s3.faast.life

    ProxyPreserveHost On

    # ProxyPass for Node.js application
    ProxyPass / http://127.0.0.1:32768/
    ProxyPassReverse / http://127.0.0.1:32768/

    RewriteEngine on
    RewriteCond %{HTTP:UPGRADE} ^WebSocket$ [NC]
    RewriteCond %{HTTP:CONNECTION} ^Upgrade$ [NC]
    RewriteRule .* ws://127.0.0.1:32768%{REQUEST_URI} [P]

    DocumentRoot /home/antoine/apps/s3.faast.life
    ErrorLog /var/log/apache2/.log
    CustomLog /var/log/apache2/.log combined

    <Directory /home/antoine/apps/s3.faast.life>
        Options Indexes FollowSymLinks
        AllowOverride All
        Require all granted
    </Directory>


SSLCertificateFile /etc/letsencrypt/live/s3.faast.life/fullchain.pem
SSLCertificateKeyFile /etc/letsencrypt/live/s3.faast.life/privkey.pem
Include /etc/letsencrypt/options-ssl-apache.conf
</VirtualHost>
</IfModule>
I have an ML-2165w printer my dad gave me. It’s a great little laser printer—compact and cheap to run. But I found you can’t install the driver on the newest Mac anymore, even though the hardware works just fine.
I didn’t want to throw this printer away, as it’s still working! I found Michele Nasti’s blog mentioning a way to make it work with the newest Mac. I’m writing an article to keep a copy of the technique in case that blog goes down. I’m also providing the drivers I’ve downloaded from the official HP site.
Here’s the solution:
- Download the Mac v11 driver from this link. In the dropdown box, select macOS 11, and you’ll get the driver in the correct version, V.3.93.01. Be sure to avoid the Mac 10.15 driver listed on the same page.
I’m going to keep a copy of this file on my site just in case
-
Open the .dmg file.
-
Click on
MAC_Printer, thenPrinter Driver.pkg, and follow the installation steps. -
When prompted to connect the printer, you need to perform an additional step:
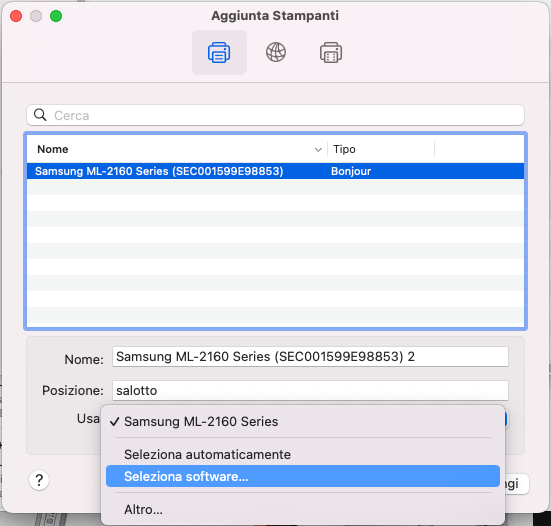
- Instead of using the proposed driver, select the driver from the list. The proposed driver will not work.
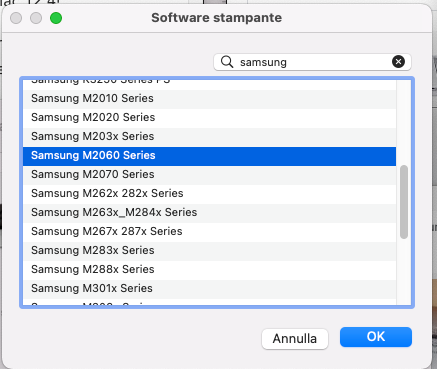
– From the list, choose the driver for the Samsung M2060 series.
And there you have it! Your old Samsung ML-2165w printer should now work perfectly with your new Mac.
Again thanks to Michele Nasti for the tip 👍
When deploying this site on Fastly CDN (Varnish), everything worked except for a redirect issue on the home page. After extensive troubleshooting, I discovered the cause of the problem. I felt it was important to document this to save you time if you encounter the same issue.
The issue I had only on the home page :
ERR_TOO_MANY_REDIRECTS
How to fix it
Add to your wp-config.php the following code :
if (!empty($_SERVER['HTTP_X_FORWARDED_HOST'])) {
    $_SERVER['HTTP_HOST'] = $_SERVER['HTTP_X_FORWARDED_HOST'];
}
Here the idea is to set the $_SERVER['HTTP_HOST'] with the value of $_SERVER['HTTP_X_FORWARDED_HOST'], as the HTTP_X_FORWARDED_HOST header contains the original host requested by the user.
Another implementation could be to set the HTTP_HOST in raw :
if ( ! empty( $_SERVER['HTTP_X_FORWARDED_HOST'] ) ) {
       $_SERVER['HTTP_HOST'] = 'domain.com';
}
The WordPress code responsible of the redirect
In the WordPress code in the file : /wp-includes/canonical.php WordPress tries to redirect the client to the canonical home page by using the HTTP_HOST
if ( ! $requested_url && isset( $_SERVER['HTTP_HOST'] ) ) {
  // Build the URL in the address bar.
  $requested_url  = is_ssl() ? 'https://' : 'http://';
  $requested_url .= $_SERVER['HTTP_HOST'];
  $requested_url .= $_SERVER['REQUEST_URI'];
}
But when we work with a reverse proxy the HTTP_X_FORWARDED_HOST should be used instead.
In this project, I will deploy a static website on Minio, an Amazon S3 alternative. My goal is to use this S3-compatible storage as the backend for my website. To ensure the app can scale globally and handle high traffic, I will use Fastly Compute to distribute and cache the content.
Upload Files to Minio S3
This will provide a public URL for accessing the stored content. However, since Minio is self-hosted, it may not handle a high volume of traffic efficiently on its own.
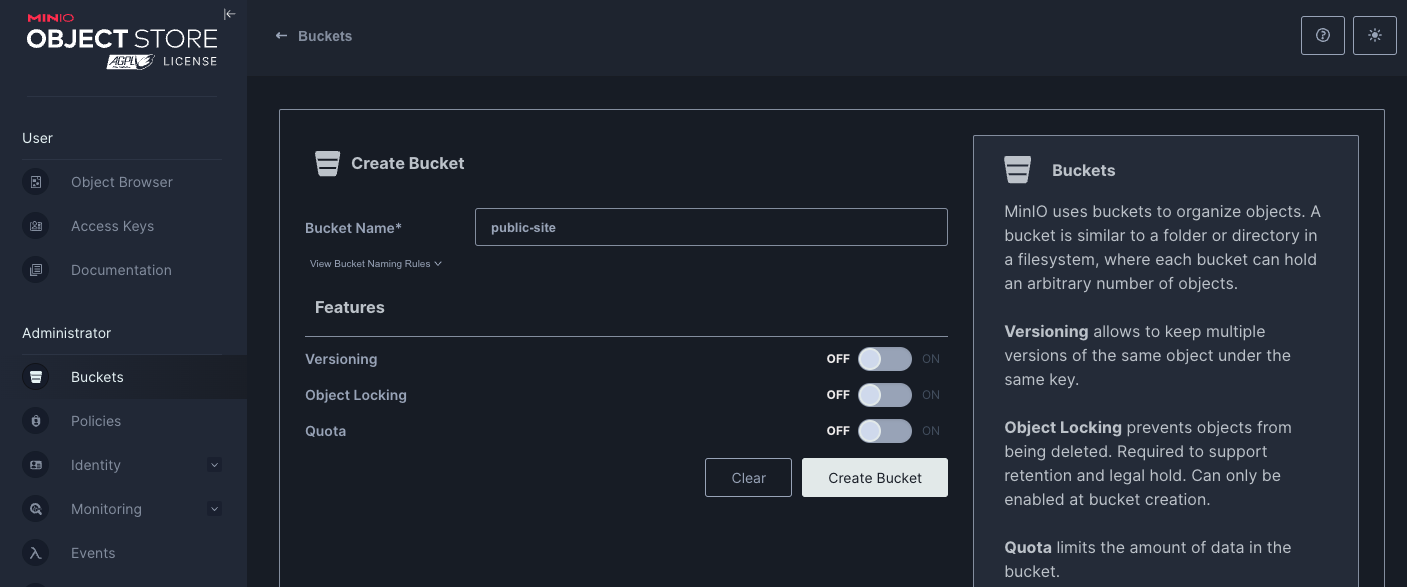
First, create a bucket in Minio and configure it to be publicly accessible for read-only operations.
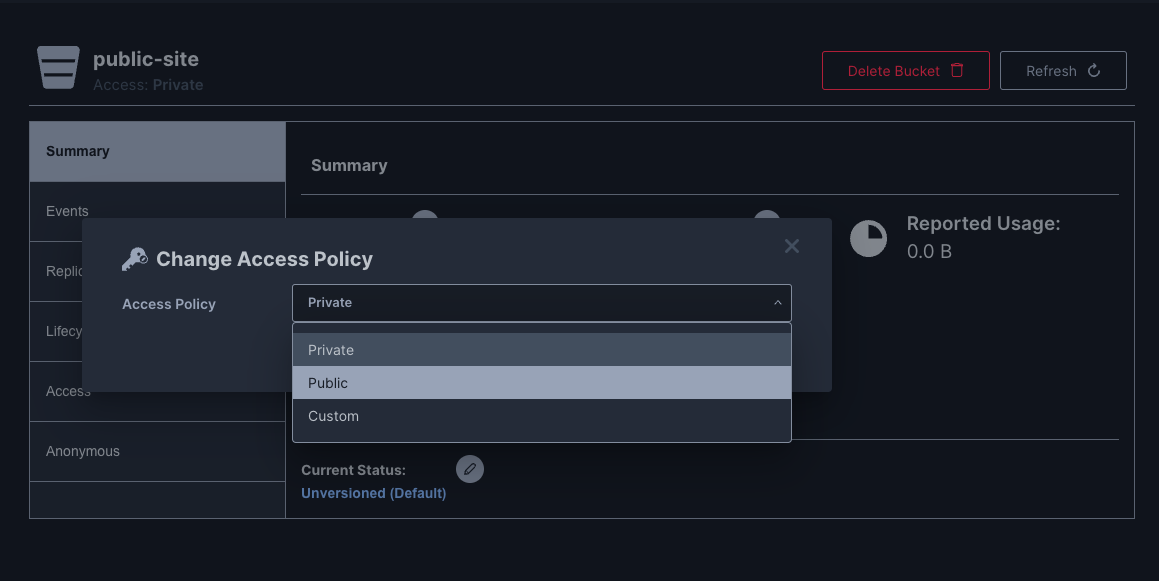
Then I change the Access Policy to be public.
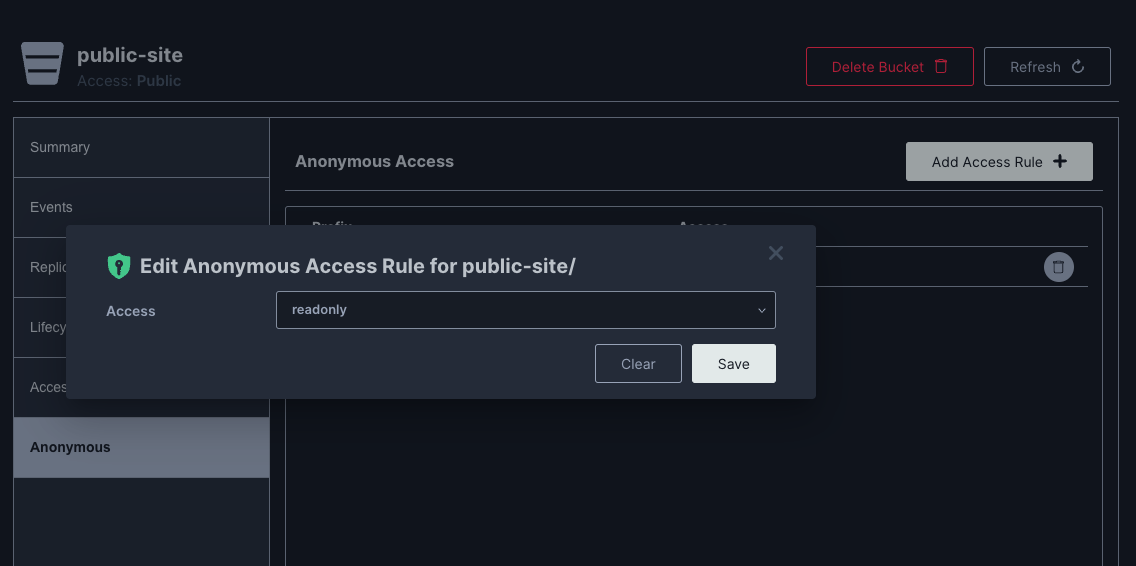
Then I set the anonymous Access Rule to readonly
Then I upload the files :
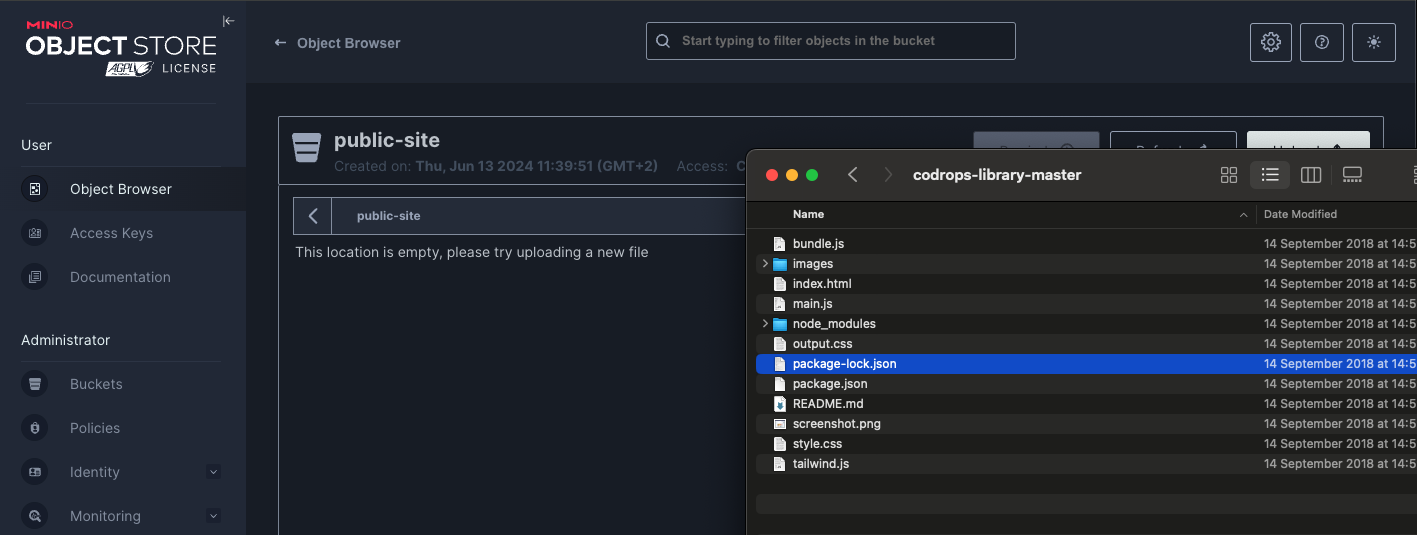
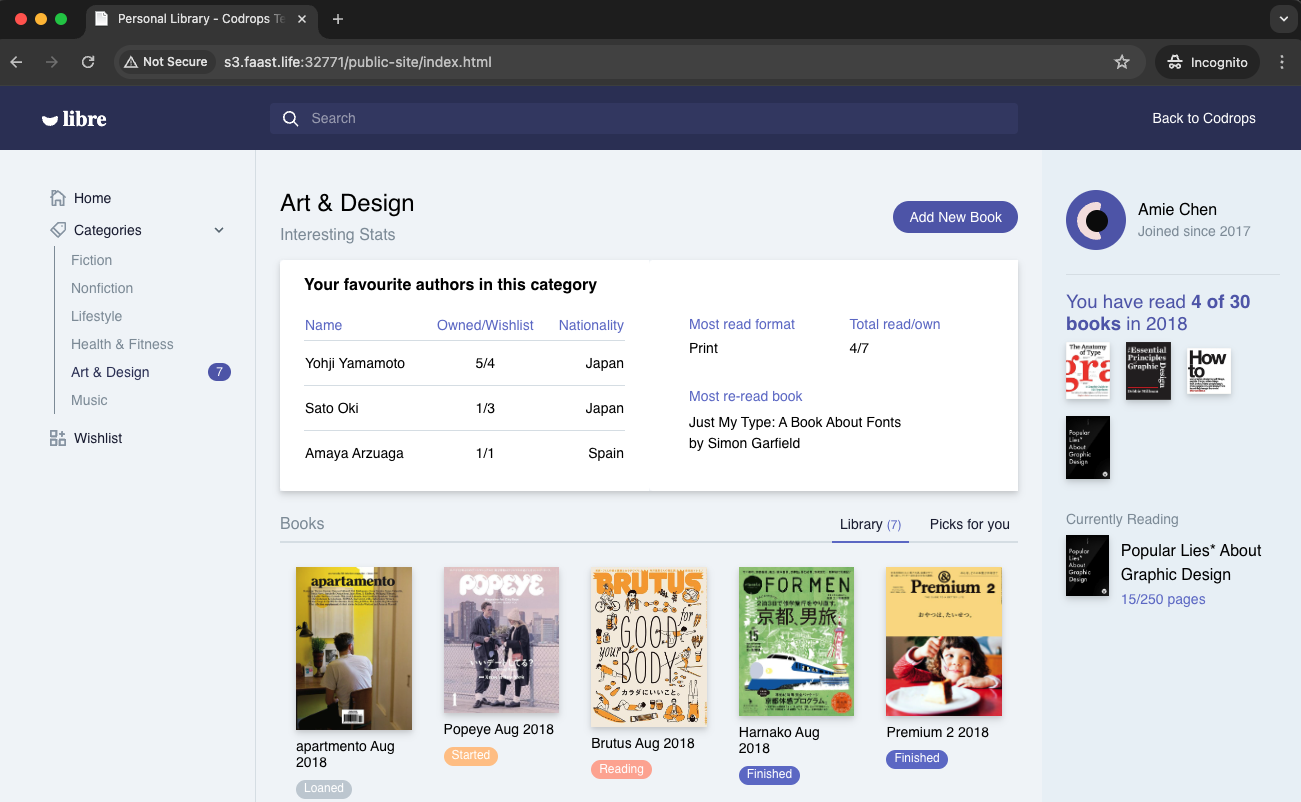
I can now access my site on my S3 bucket
http://s3.faast.life:32771/public-site/index.html
Use Fastly Compute to Serve the App Globally
The advantage of using Fastly Compute is that it enables global distribution and caching of the site hosted on Minio. By leveraging Fastly’s network, we can ensure that the content is served quickly to users around the world, effectively handling high traffic volumes and improving the site’s performance.
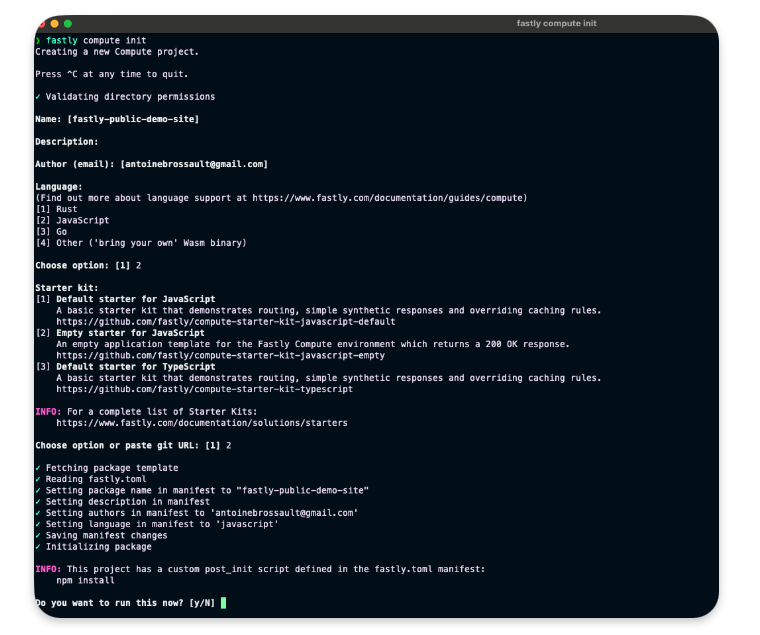
Init the compute project
In the folder of your choice :
fastly compute init
Then for the options
Language:
[2] JavaScript

...

Starter kit:
[2] Empty starter for JavaScript


...

Do you want to run this now?
Yes
Adjustment to our setup
In your package.json add this line in the scripts section :
"dev": "fastly compute serve --watch",
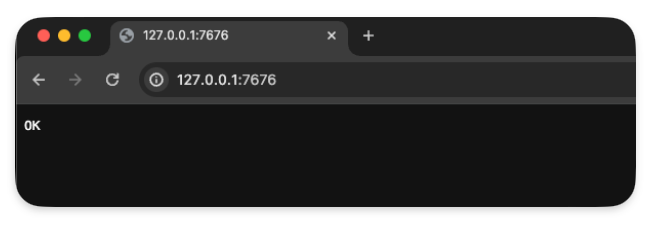
Run the project locally
run the following command to start the local server.
npm run dev
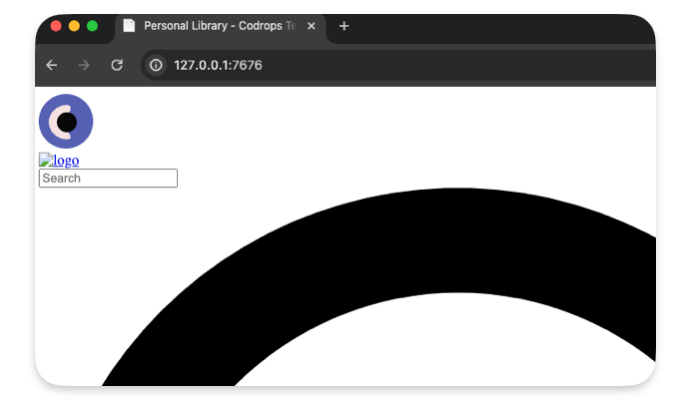
Now if you navigate to :
http://localhost:7676/
You should see something like this :
Handle requests
To handle requests, the best way is to use the @fastly/expressly that will give us a router similar to express to manage our routes.
npm install @fastly/expressly
Then use the following code
import { Router } from "@fastly/expressly";

const router = new Router();


router.get("/", async (req, res) => {


  res.send("Hello 👋");

});

router.listen();
This should return « Hello 👋 » when you visit http://localhost:7676/
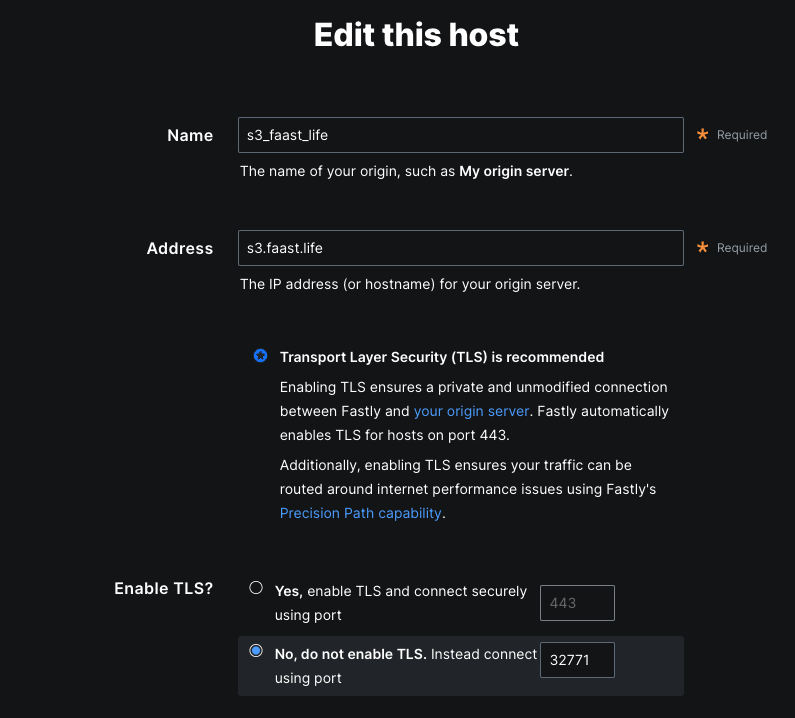
Connect our S3 backend
Now I want our compute function to query our S3 bucket on this url http://s3.faast.life:32771/public-site/index.html when we go to http://localhost:7676/
Add the backend to the fastly.toml file :
[local_server]
  [local_server.backends]
    [local_server.backends.s3_faast_life]
      override_host = "s3.faast.life"
      url = "http://s3.faast.life:32771"
Call your backend
router.get("/", async (req, res) => {

  let beResp = await fetch(
    "http://s3.faast.life:32771/public-site/index.html",
    {
      backend: "s3_faast_life"
    }
  );

  res.send(beResp);

});
It should display a page with broken CSS /JavaScript… That’s normal, as we don’t handle the css,JavaScript files requests yet.
Handle the JavaScript / CSS / images requests
To make our site work we need to point the asset to the right location.
This following code gets the pathname and match it to our S3 bucket
router.get(/\.(jpe?g|png|gif|jpg|css|js|svg)$/, async (req, res) => {

  const pathname = new URL(req.url).pathname;

  if(!pathname) res.withStatus(500).json({error : "no pathname"});

  let beResp = await fetch(
      `http://s3.faast.life:32771/public-site${pathname}`, {
      backend: "s3_faast_life"
    }
  );

  res.send(beResp);

});
Deploy the project
It’s now time to deploy the project to the Fastly Network, to do so run the following command :
npm run deploy
❯ npm run deploy

> deploy
> fastly compute publish

✓ Verifying fastly.toml
✓ Identifying package name
✓ Identifying toolchain
✓ Running [scripts.build]
✓ Creating package archive

SUCCESS: Built package (pkg/fastly-public-demo-site.tar.gz)

✓ Verifying fastly.toml


INFO: Processing of the fastly.toml [setup] configuration happens only for a new service. Once a service is
created, any further changes to the service or its resources must be made manually.
Select a domain name
Domain: [inherently-elegant-eft.edgecompute.app] publicSiteDemo.edgecompute.app


✓ Creating domain 'publicSiteDemo.edgecompute.app'
✓ Uploading package
✓ Activating service (version 1)
✓ Creating domain 'publicSiteDemo.edgecompute.app'
✓ Uploading package
✓ Activating service (version 1)

Manage this service at:
        https://manage.fastly.com/configure/services/6lyvl2bwrC9smHn3coFbv3

View this service at:
        https://publicSiteDemo.edgecompute.app

SUCCESS: Deployed package (service 6lyvl2bwrC9smHn3coFbv3, version 1)
Edit the backend
We need to create a backend that will reflect the options we used with our local configuration.
Save the configuration
Test the deployment
Now we can visit our website to check the deployement
https://publicsitedemo.edgecompute.app/
If everything worked as expected, we should see our site :

Use Fastly core cache to scale
So far we only forward the requests to our S3 bucket, but this doesn’t really help to scale, that’s why we need to add some caching by using the Fastly core cache
Add caching
import { CacheOverride } from "fastly:cache-override";
Update our backend calls
Now let’s add caching with the CacheOverride object.
Keep the index.html in cache for 10min :
router.get("/", async (req, res) => {
  let beResp = await fetch(
    "http://s3.faast.life:32771/public-site/index.html",
    {
      backend: "s3_faast_life",
      cacheOverride: new CacheOverride("override", {
          ttl: 60 * 10 // cache this request for 10min
      })
    },
  );

  res.send(beResp);

});
And we do the same thing for the assets :
router.get(/\.(jpe?g|png|gif|jpg|css|js|svg)$/, async (req, res) => {

  const pathname = new URL(req.url).pathname;

  if(!pathname) res.withStatus(500).json({error : "no pathname"});

  let beResp = await fetch(
      `http://s3.faast.life:32771/public-site${pathname}`, {
      backend: "s3_faast_life",
      cacheOverride: new CacheOverride("override", {
        ttl: 60 * 10 // cache this request for 10min
      })
    }
  );

  res.send(beResp);

});
Check if our content is cached :
curl -sSL -D - "https://publicsitedemo.edgecompute.app/" -o /dev/null
This should return
HTTP/2 200
accept-ranges: bytes
x-served-by: cache-par-lfpg1960086-PAR
content-type: text/html
etag: "47b56ea2f1770dc224f2047b30c57d15"
last-modified: Thu, 13 Jun 2024 09:44:52 GMT
server: MinIO
strict-transport-security: max-age=31536000; includeSubDomains
vary: Origin, Accept-Encoding
x-amz-id-2: dd9025bab4ad464b049177c95eb6ebf374d3b3fd1af9251148b658df7ac2e3e8
x-amz-request-id: 17D899918B3C2797
x-content-type-options: nosniff
x-xss-protection: 1; mode=block
date: Thu, 13 Jun 2024 15:21:48 GMT
age: 3098
x-cache: HIT
x-cache-hits: 4
content-length: 26217
The content is served from the Paris’ POP :
x-served-by: cache-par-lfpg1960086-PAR
x-cache: HIT
x-cache-hits: 4
Add compression to our static files
By default our text based files, HTML, CSS, JavaScript… are not compressed by our S3 bucket. We can activate compression at our compute level by simple adding a x-compress-hint header. This will speed up our website.
router.use((req, res) => {
  // Activate compression on all requests
  res.headers.set("x-compress-hint", "on");
});
On my VPS I set up Minio an alternative to Amazon S3, I set up Minio trough Docker and Portainer. Everything worked great but some part of the Minio Interface. That interface relies on Websocket, and as I serve the minio UI through an Apache revere proxy, I had to forward those Websocket to the right direction.
The Websocket issue :
Error in websocket connection. Attempting reconnection...
objectBrowserWSMiddleware.ts:79 WebSocket connection to 'wss://s3.faast.life/ws/objectManager' failed:
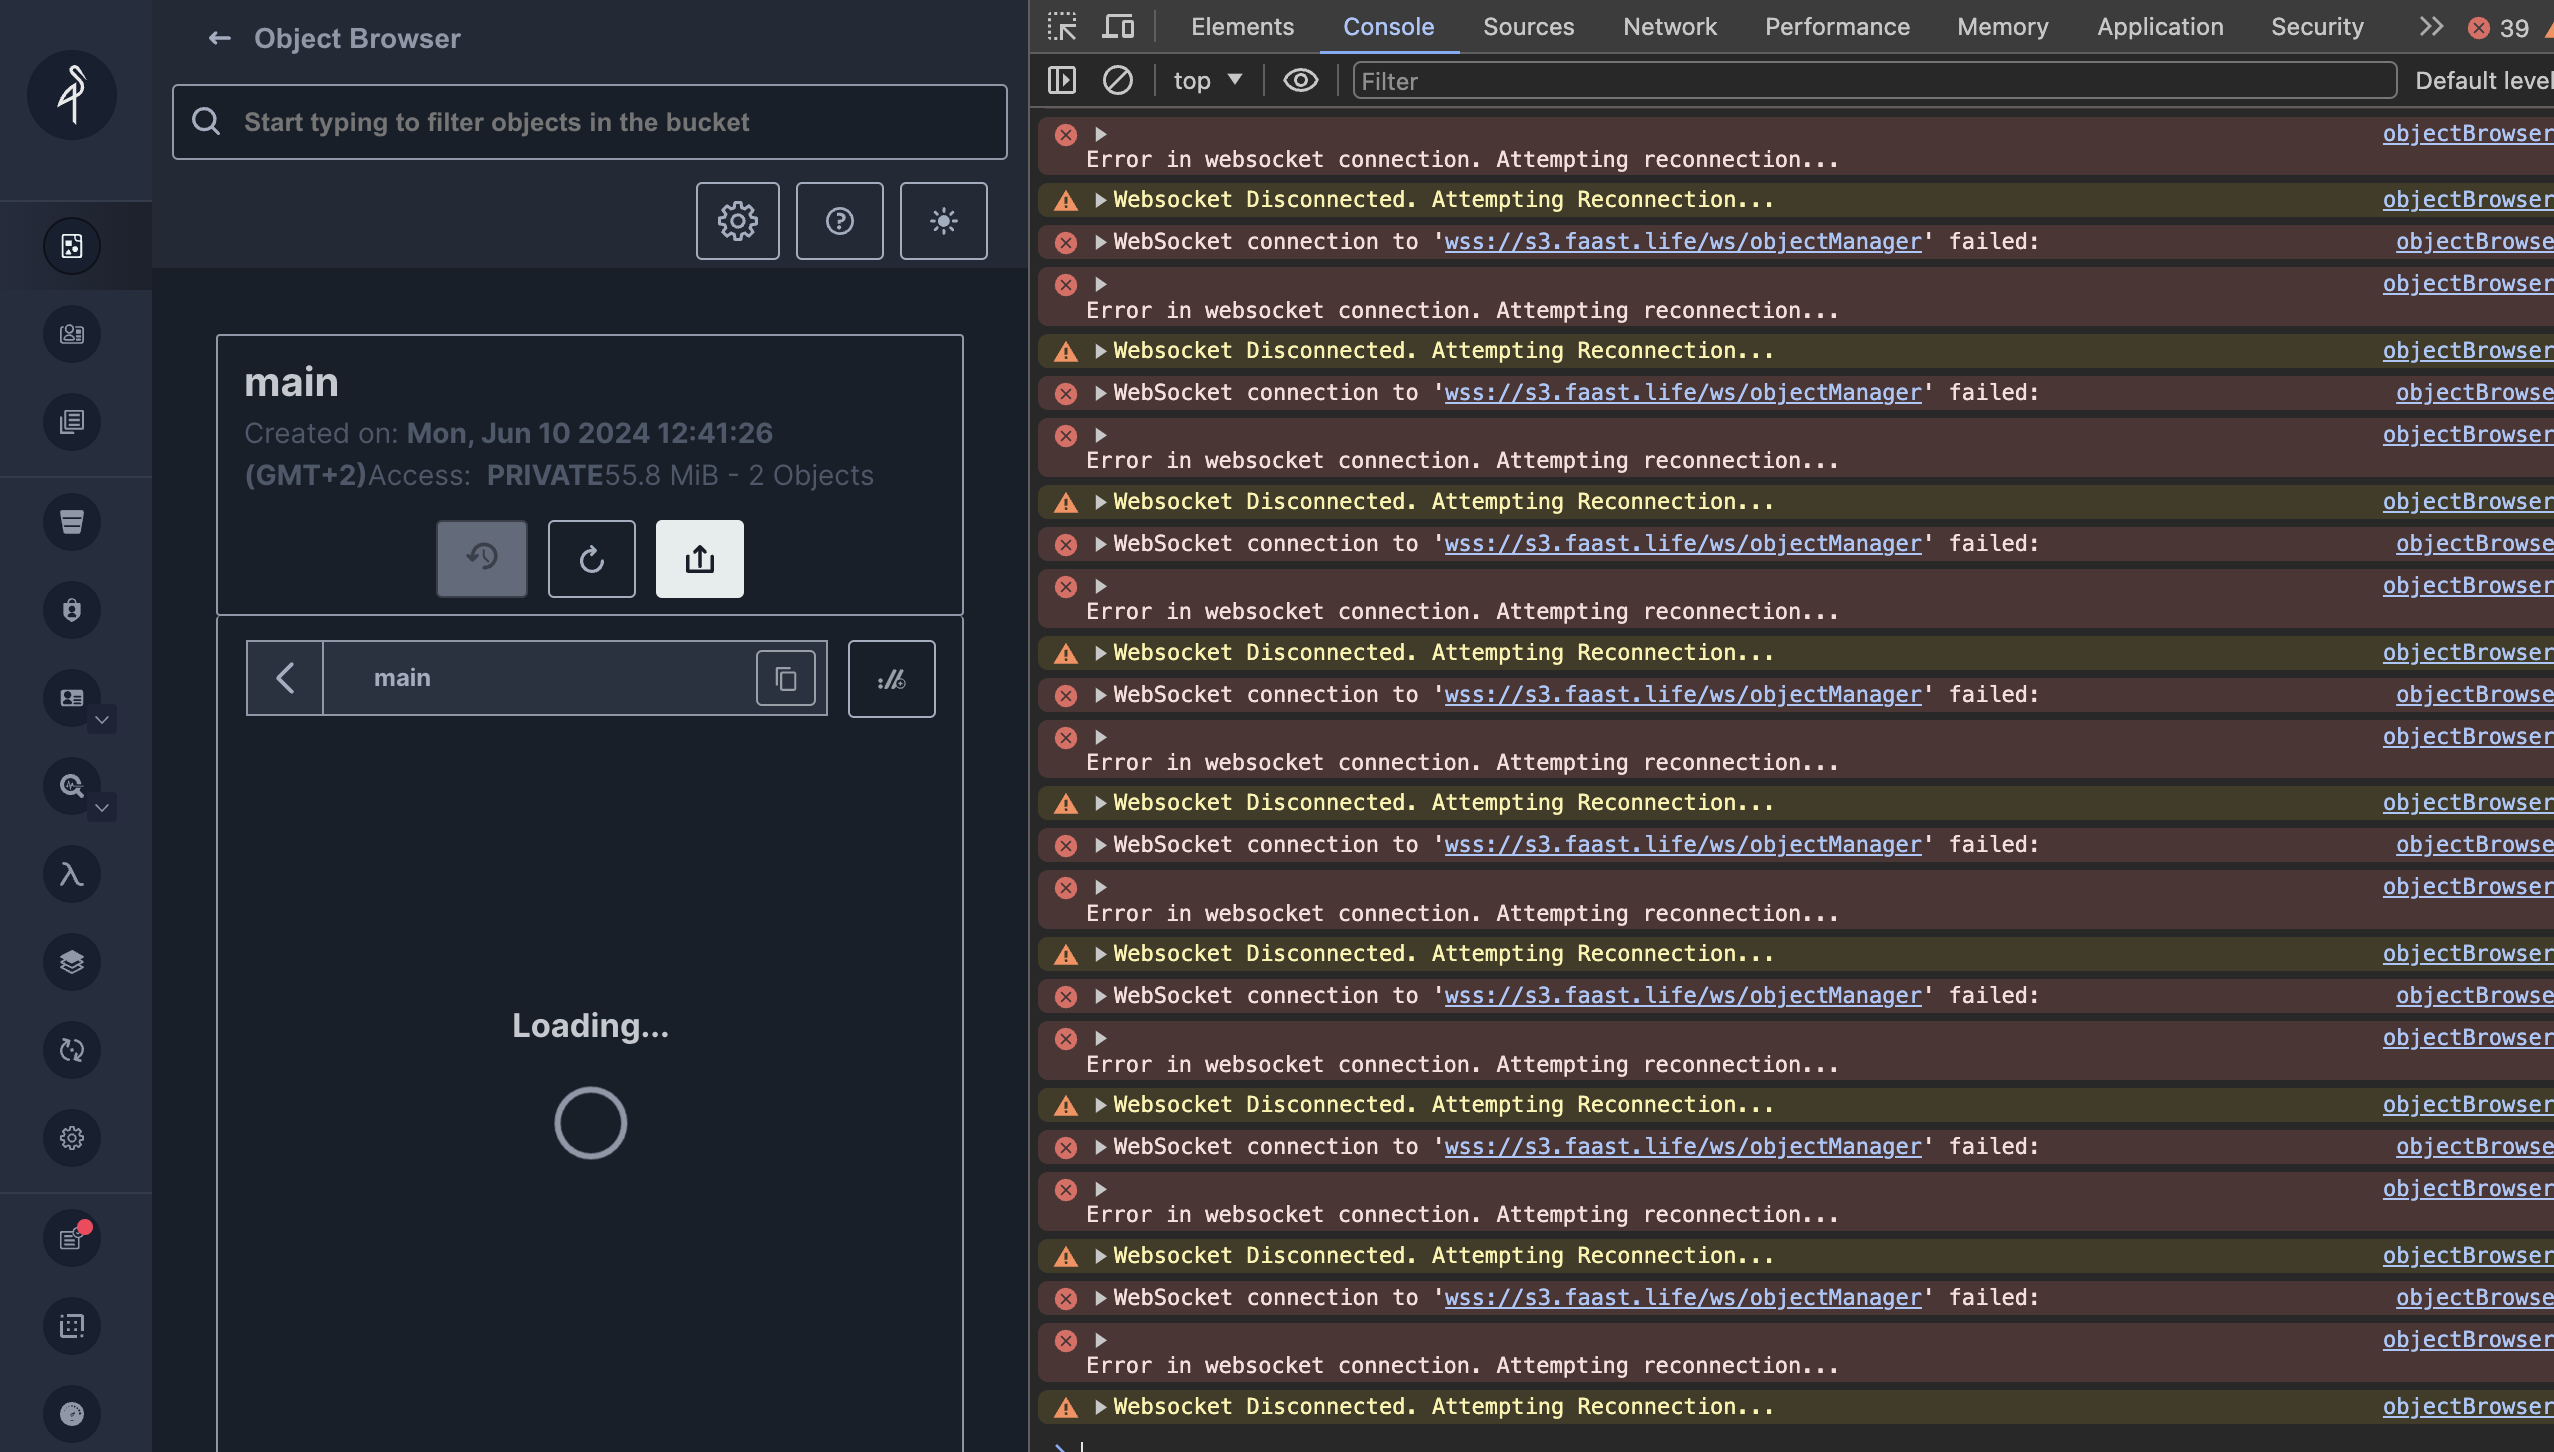
This is how I managed to fix it :
Install apache2 module
sudo a2enmod proxy_wstunnel
Edit the virtual host
Add this rewrite to point the websocket requests to the right direction :
   RewriteEngine on
    RewriteCond %{HTTP:UPGRADE} ^WebSocket$ [NC]
    RewriteCond %{HTTP:CONNECTION} ^Upgrade$ [NC]
    RewriteRule .* ws://127.0.0.1:32768%{REQUEST_URI} [P]
The final virtual host should look like this:
<IfModule mod_ssl.c>
<VirtualHost *:443>
    ServerAdmin webmaster@s3.faast.life
    ServerName s3.faast.life

     ProxyPreserveHost On

    # ProxyPass for Node.js application
    ProxyPass / http://127.0.0.1:32768/
    ProxyPassReverse / http://127.0.0.1:32768/

    RewriteEngine on
    RewriteCond %{HTTP:UPGRADE} ^WebSocket$ [NC]
    RewriteCond %{HTTP:CONNECTION} ^Upgrade$ [NC]
    RewriteRule .* ws://127.0.0.1:32768%{REQUEST_URI} [P]

SSLCertificateFile /etc/letsencrypt/live/s3.faast.life/fullchain.pem
SSLCertificateKeyFile /etc/letsencrypt/live/s3.faast.life/privkey.pem
Include /etc/letsencrypt/options-ssl-apache.conf
</VirtualHost>
</IfModule>
Reload Apache2
Note : You don’t need to disable and enable the site to apply the config. A reload is enough.
systemctl reload apache2
Imagine a mailman delivering packages in a large city. In a typical scenario, the mailman delivers a package to a specific house based on the address. Simple, right? Now, let’s make it a bit more complex. Instead of delivering to houses, the mailman is delivering to a huge apartment building with multiple apartments inside. The address of the building is like a web server hosting multiple websites. Each apartment inside represents a different website hosted on that same server.
The Mailman’s Challenge
For the mailman to successfully deliver the package to the correct apartment, he needs more than just the building’s address; he needs the specific apartment number. This is where Server Name Indication (SNI) comes in.
SNI is like a tag on the package that tells the mailman exactly which apartment (or website) to deliver to. Without this tag, the mailman would be left standing in front of the building, unsure of which apartment to go to. Similarly, without SNI, the server wouldn’t know which website the client is trying to reach, leading to confusion and potential errors.
Why SNI is Crucial
When a web browser tries to connect to a website, it first establishes a secure connection using HTTPS. This process involves a conversation between the browser (client) and the web server, where they agree on how to encrypt the data to keep it secure. This conversation happens before any actual web content is exchanged.
Here’s where SNI plays a vital role:
- Initial Connection: When the browser reaches out to the server, it includes the name of the website it wants to connect to in the initial handshake process. This is the SNI.
- Server’s Response: The server uses this information to present the correct SSL/TLS certificate, which is essentially the building’s nameplate that confirms the server’s identity.
- Secure Communication: With the correct certificate in place, the secure communication channel is established, and the browser can now access the specific website it requested.
Without SNI, the server wouldn’t know which certificate to present, as it hosts multiple websites (apartments) on the same IP address (building). This would be like the mailman knowing only the building’s address but not the specific apartment number, leading to confusion and failed deliveries.
The Technical Flow
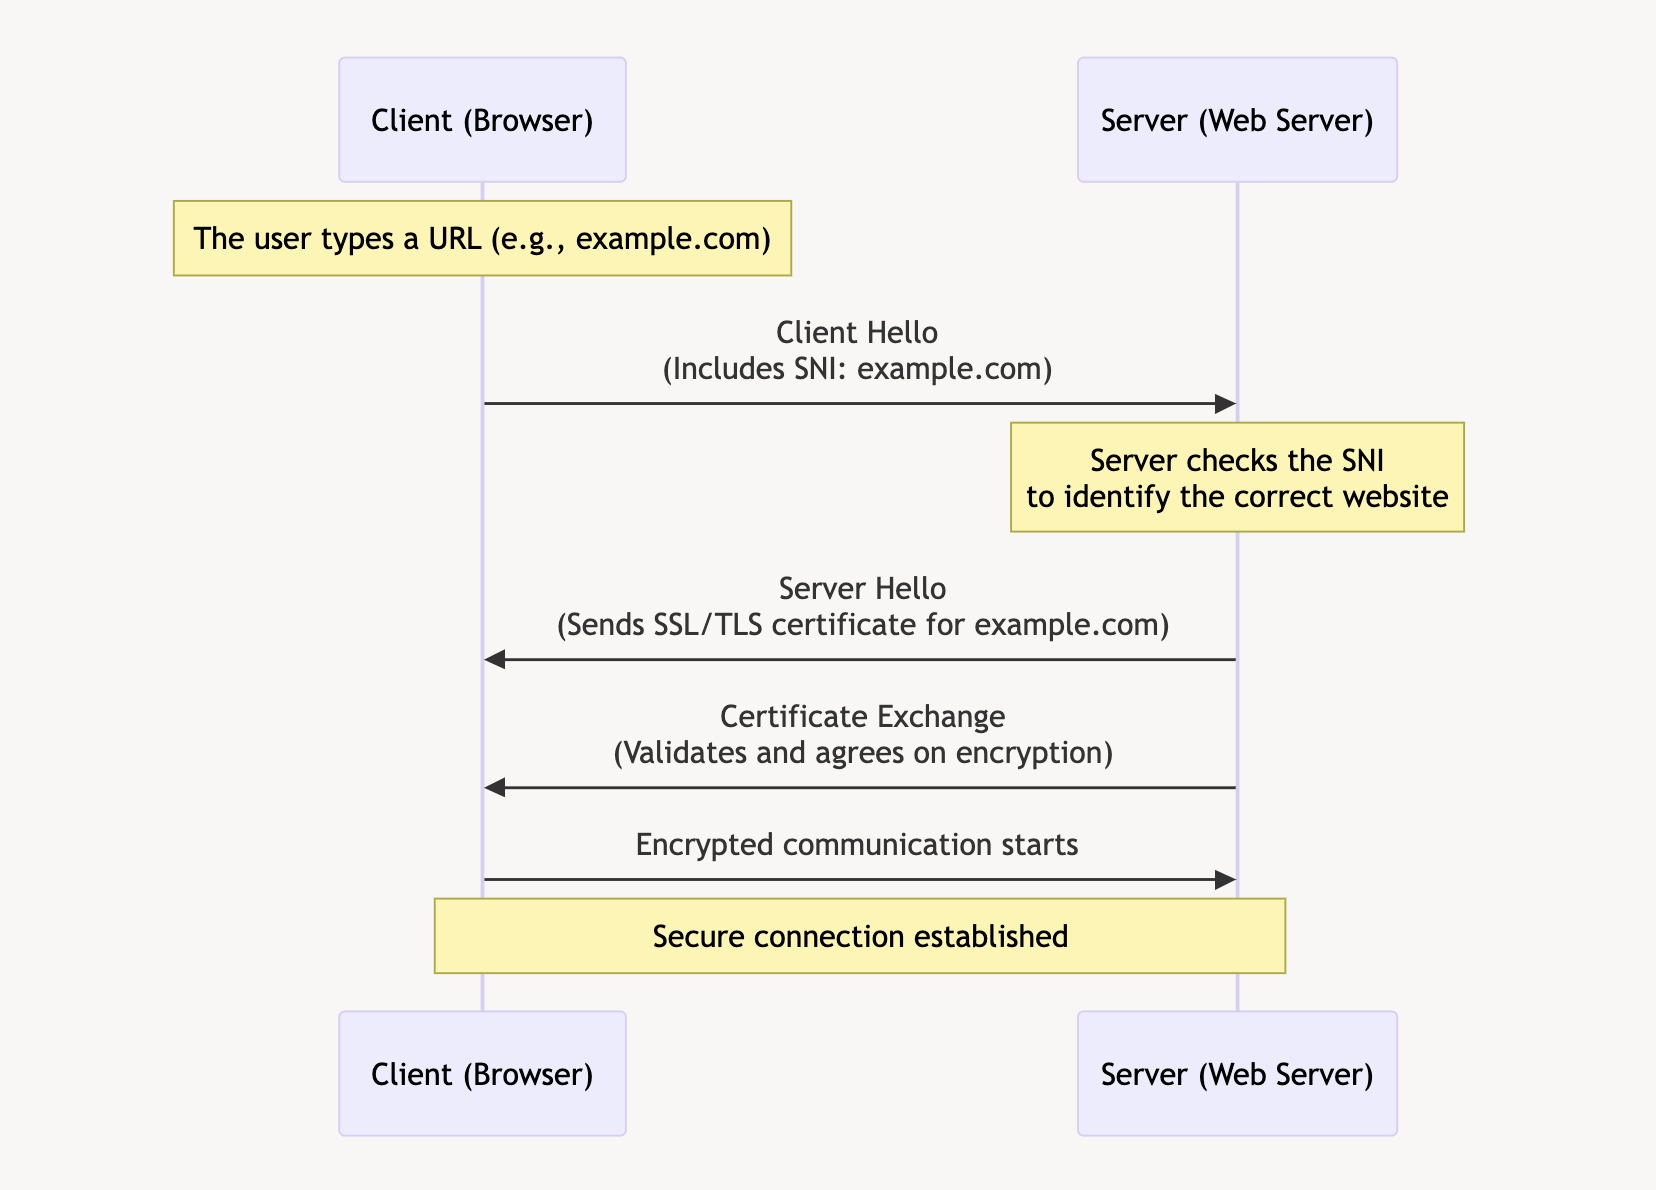
- Client Hello: The client’s browser sends a « Client Hello » message to the server, including the SNI, which specifies the desired hostname.
- Server Hello: The server receives this message and looks at the SNI to determine which SSL/TLS certificate to use.
- Certificate Exchange: The server sends back the appropriate certificate for the requested hostname.
- Secure Connection Established: Both the client and server agree on encryption methods, and a secure session is established.
The Importance of SNI
SNI is crucial because it allows multiple SSL/TLS certificates to be hosted on the same IP address. This is especially important for shared hosting environments, where multiple websites are hosted on a single server. By using SNI, servers can ensure that the correct certificate is used for each website, providing secure connections and a seamless user experience.
In summary, SNI acts as the key identifier that helps the mailman (server) deliver the package (website data) to the correct apartment (website) in a large building (server with multiple websites). It ensures that the right doors are opened, allowing secure and efficient communication between the client and server.
Debugging SNI Using Wireshark
Wireshark
Wireshark is a powerful, open-source network protocol analyzer that allows users to capture and interactively browse the traffic running on a computer network. It provides detailed visibility into network activity, making it an essential tool for network troubleshooting, analysis, and security monitoring.
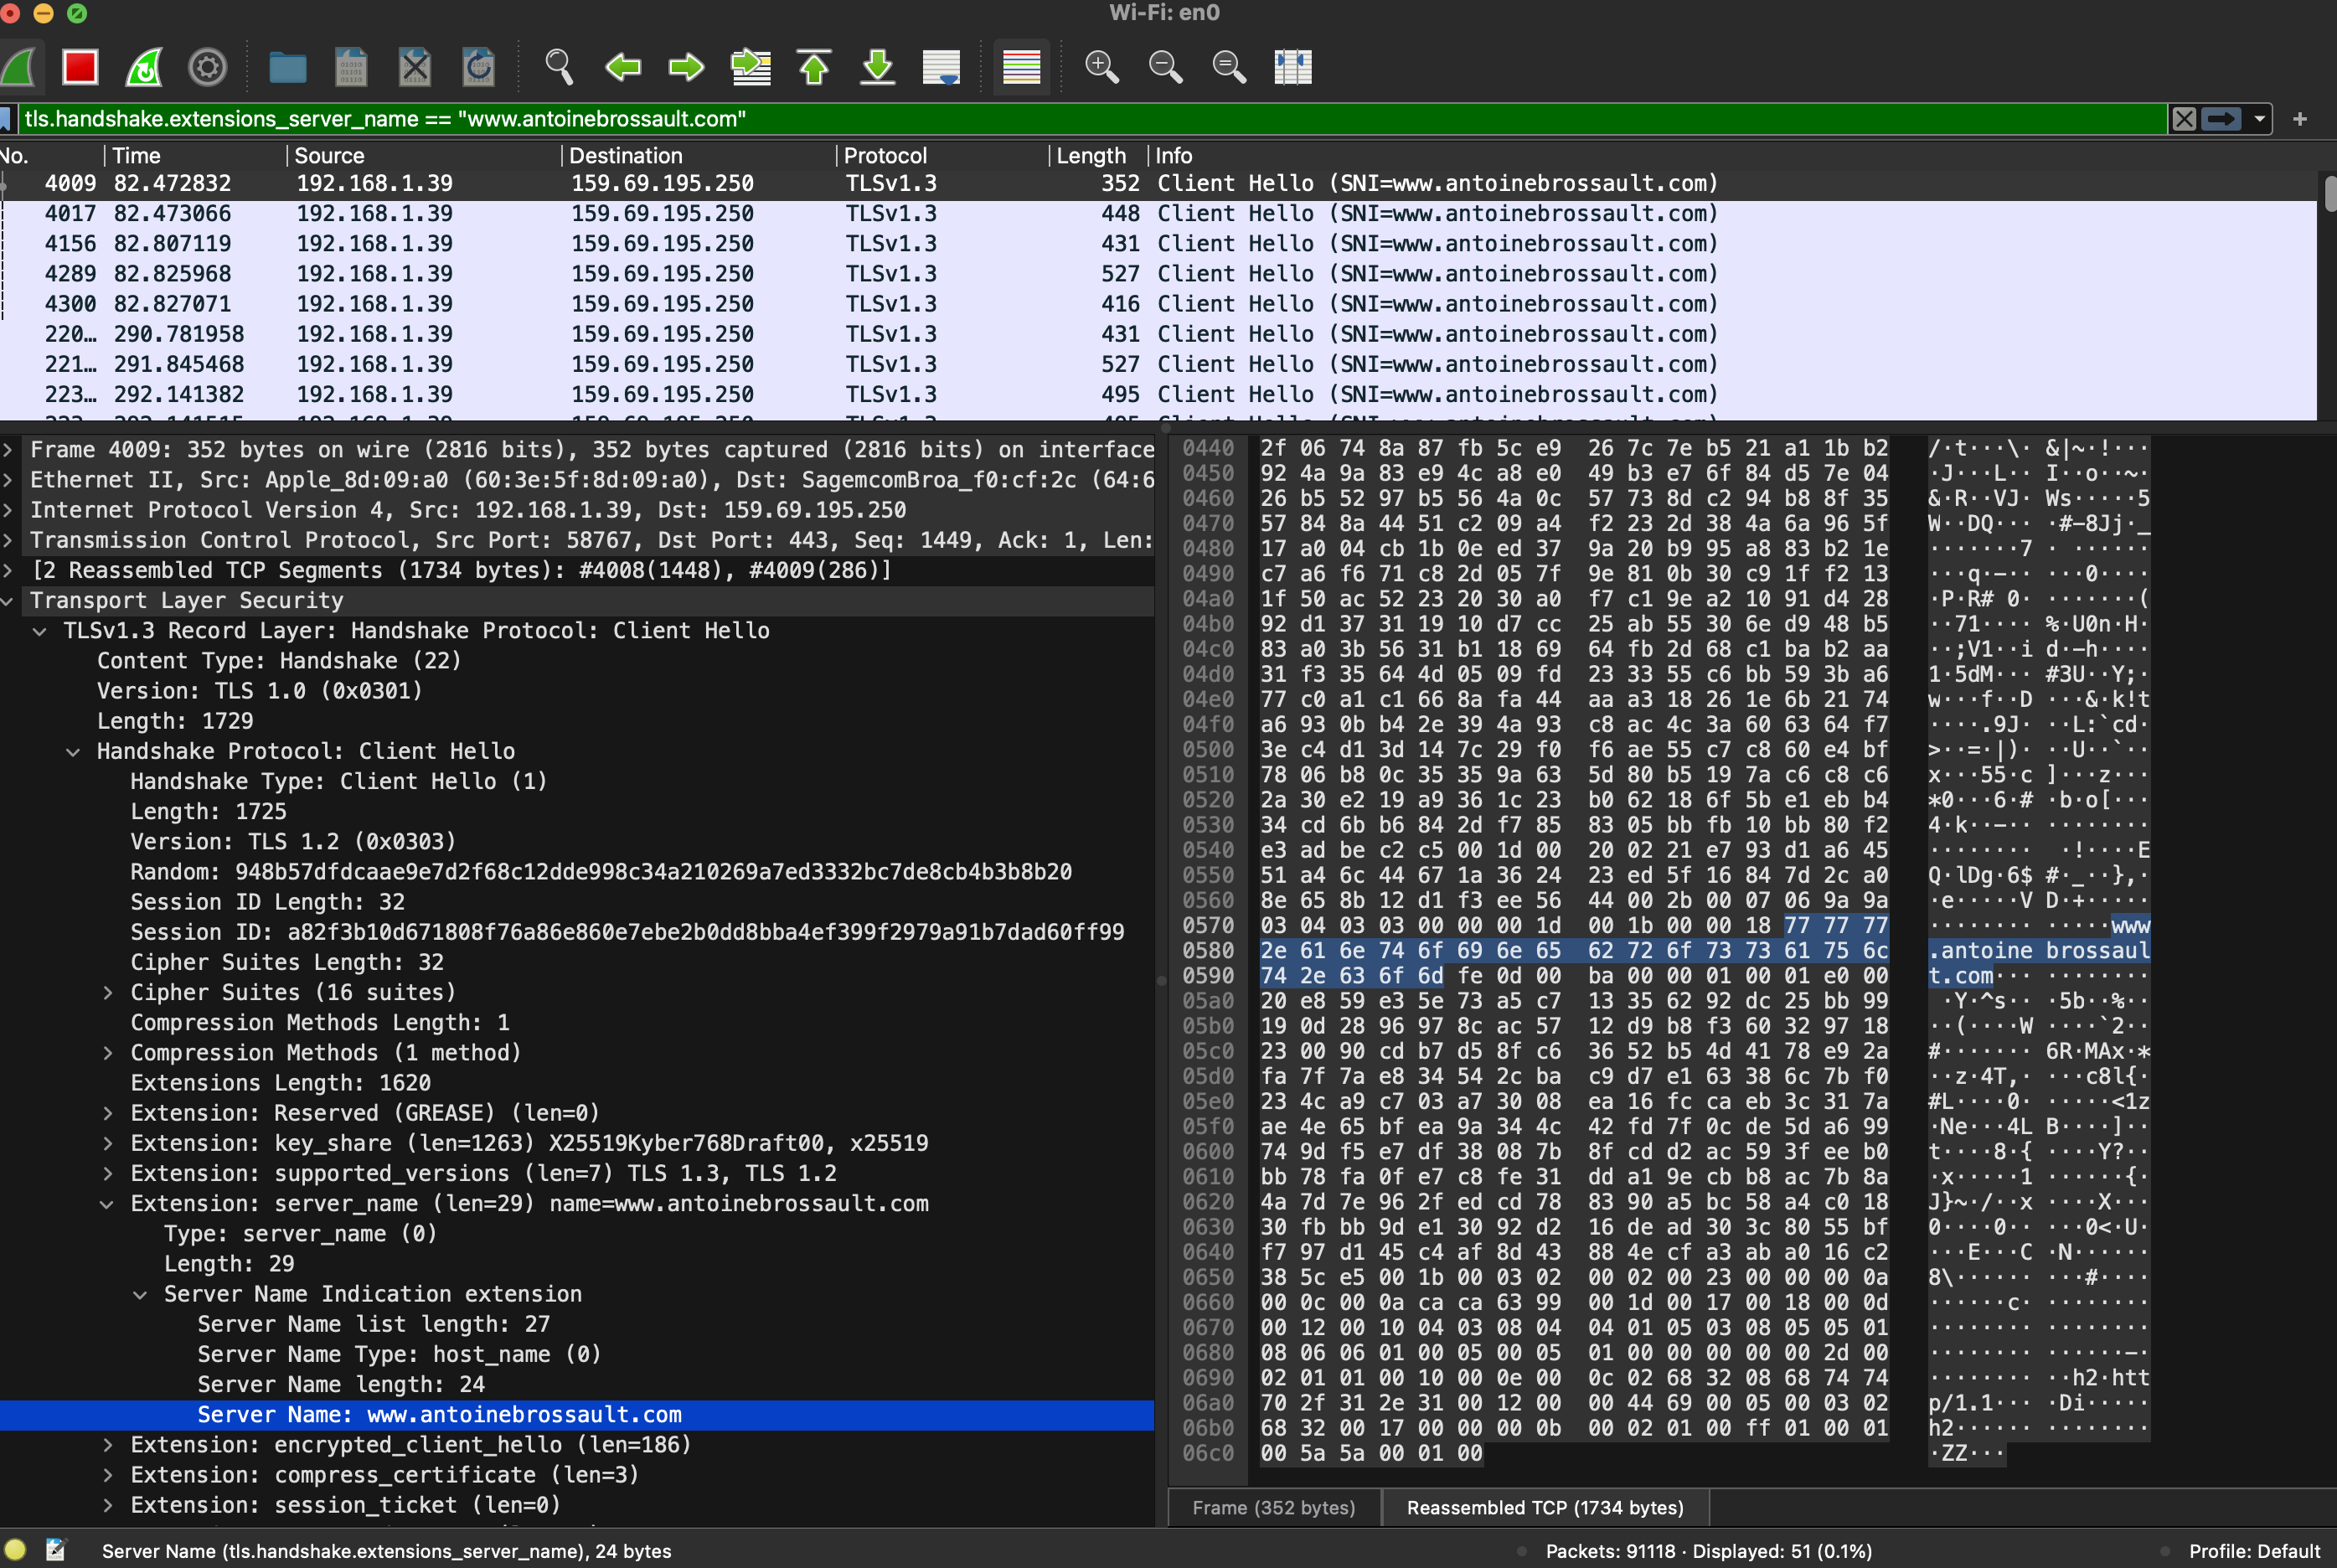
With Wireshark, use the following filter; obviously replace the domain name with the one you are currently debugging.
tls.handshake.extensions_server_name == "www.antoinebrossault.com"
Then visit the site you are debugging, then you should get something like this:
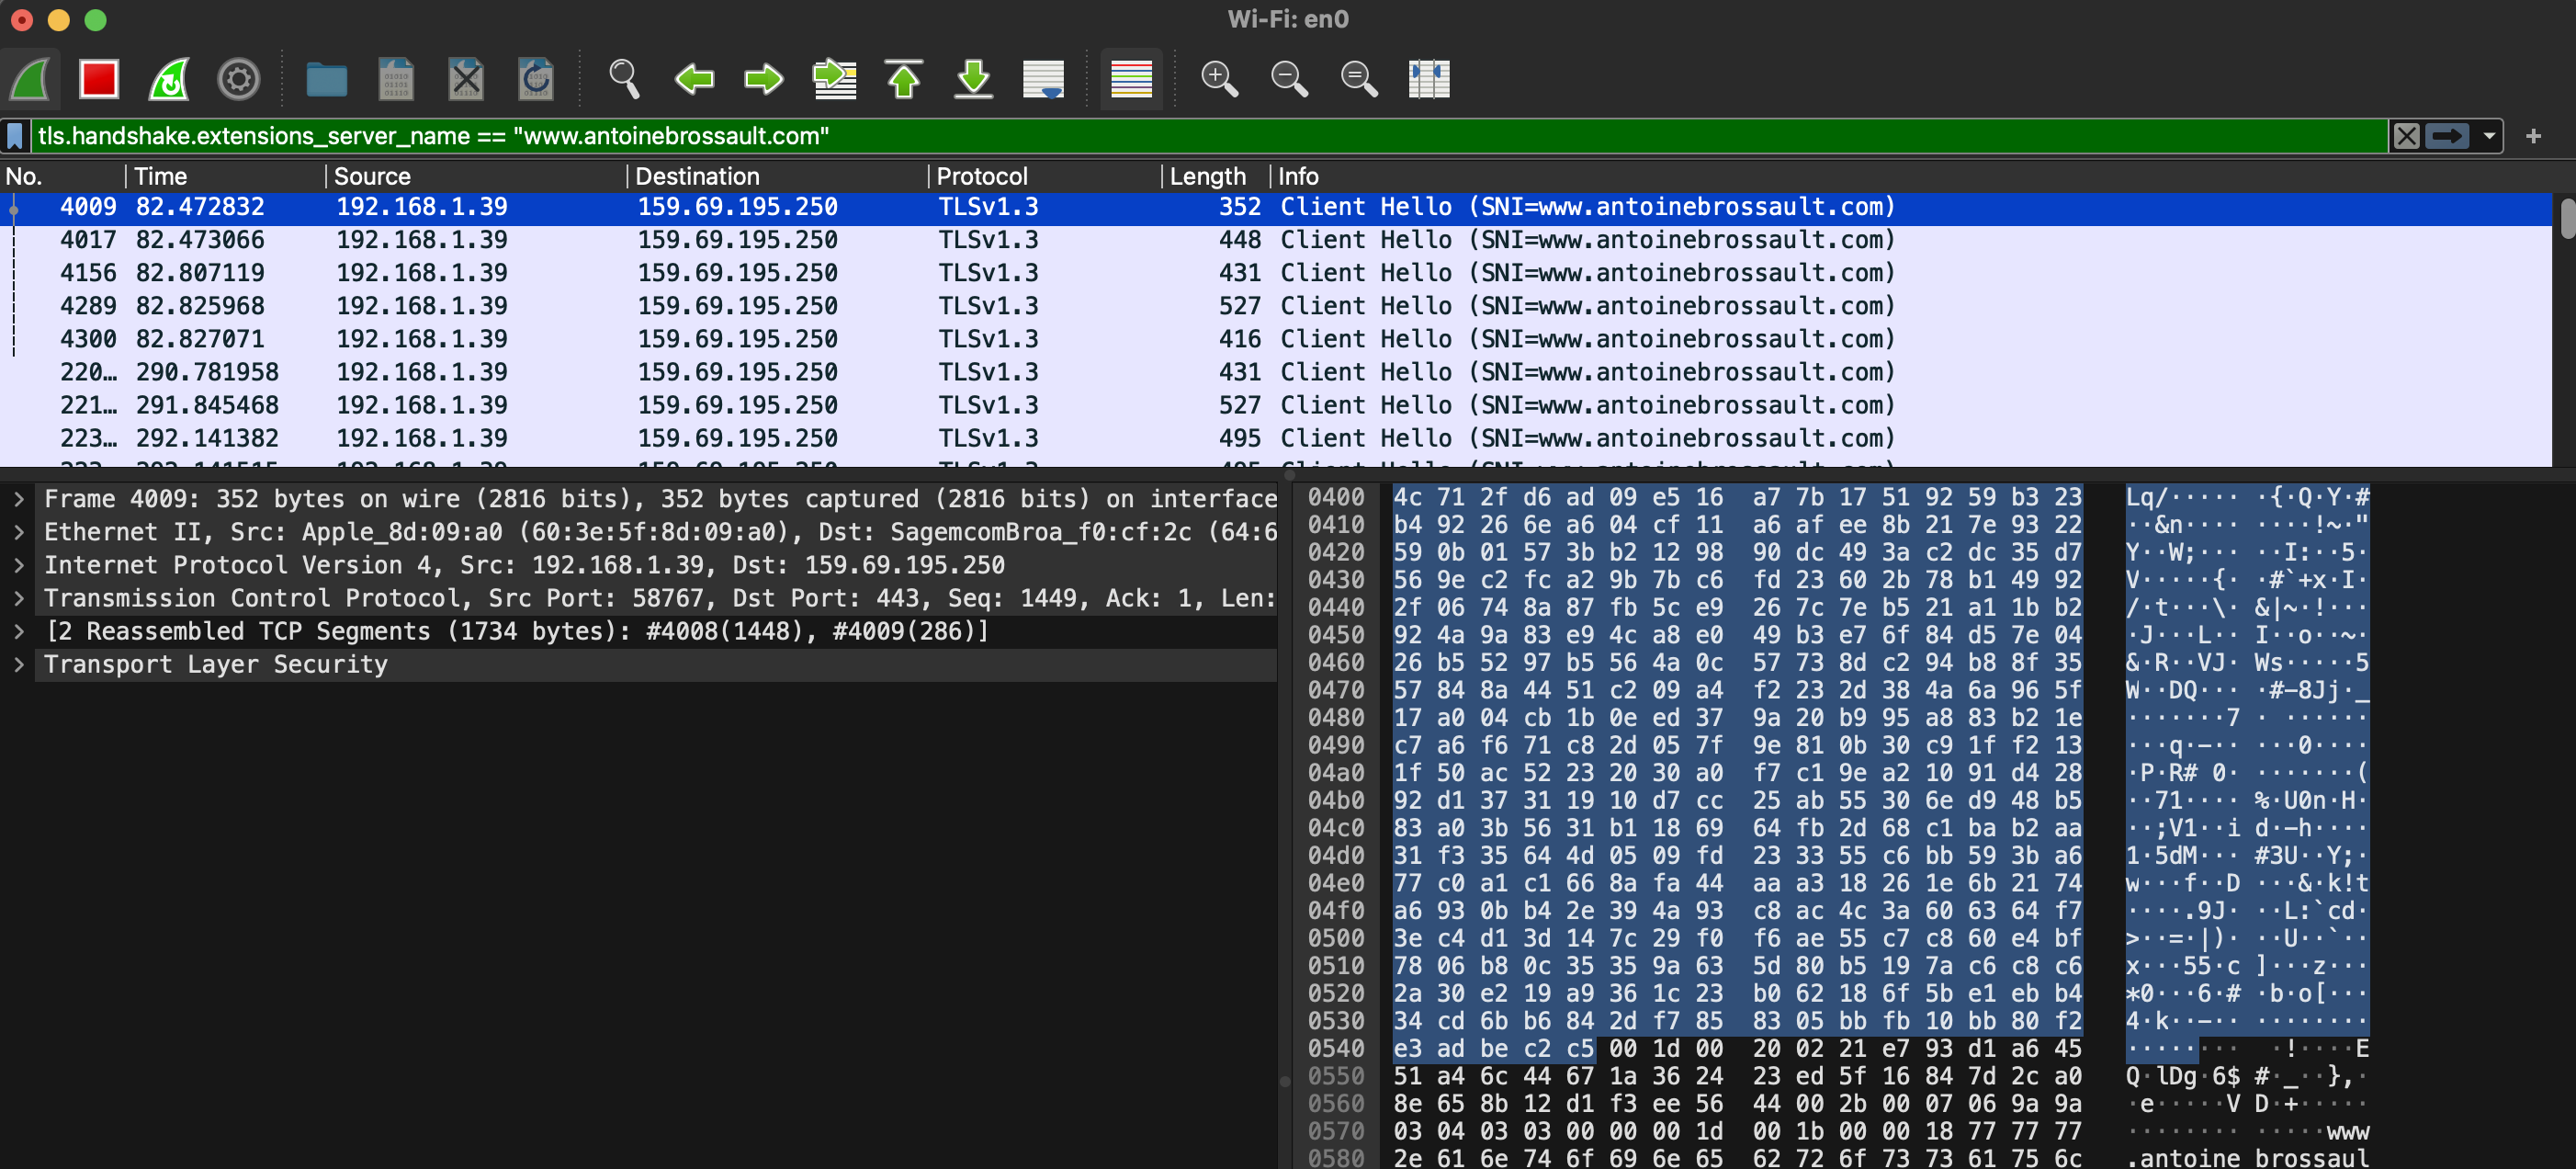
Then unfold the Transport Layer Security section, then TLS; then, navigate to the Handshake Protocol, followed by Extension, and finally, the Server Name.
Debugging SNI Using CLI Tools
To ensure that SNI is working correctly on your server, you can use command-line tools like openssl and curl for debugging. Here’s how you can do it:
Using OpenSSL
OpenSSL is a powerful toolkit for the Transport Layer Security (TLS) and Secure Sockets Layer (SSL) protocols. To check the SNI configuration using OpenSSL, follow these steps:
- Open a terminal.
- Run the OpenSSL command with the
s_clientoption, specifying the server’s hostname and port. Replaceexample.comwith the domain you want to test and443with the appropriate port if different.
openssl s_client -connect fastly.antoinebrossault.com:443 -servername fastly.antoinebrossault.com
Here’s what each part of the command does:
– s_client: Initiates a TLS/SSL client connection.
– -connect fastly.antoinebrossault.com:443: Connects to the server at fastly.antoinebrossault.com on port 443.
– -servername fastly.antoinebrossault.com: Sets the SNI field to fastly.antoinebrossault.com.
- Examine the output: Look for the server’s certificate information in the output. You should see details that match the expected certificate for the hostname you specified.
OpenSSL Example Output:
CONNECTED(00000006)
---
Certificate chain
 0 s:CN=fastly.antoinebrossault.com
   i:C=US, O=Let's Encrypt, CN=R3
   a:PKEY: rsaEncryption, 2048 (bit); sigalg: RSA-SHA256
   v:NotBefore: Apr 21 10:21:53 2024 GMT; NotAfter: Jul 20 10:21:52 2024 GMT
 1 s:C=US, O=Let's Encrypt, CN=R3
   i:C=US, O=Internet Security Research Group, CN=ISRG Root X1
   a:PKEY: rsaEncryption, 2048 (bit); sigalg: RSA-SHA256
   v:NotBefore: Sep  4 00:00:00 2020 GMT; NotAfter: Sep 15 16:00:00 2025 GMT
 2 s:C=US, O=Internet Security Research Group, CN=ISRG Root X1
   i:O=Digital Signature Trust Co., CN=DST Root CA X3
   a:PKEY: rsaEncryption, 4096 (bit); sigalg: RSA-SHA256
   v:NotBefore: Jan 20 19:14:03 2021 GMT; NotAfter: Sep 30 18:14:03 2024 GMT
---
Server certificate
-----BEGIN CERTIFICATE-----
MIIFAzCCA+ugAwIBAgISBMUlsp2NY0QD0dyi1uUZB8vQMA0GCSqGSIb3DQEBCwUA
MDIxCzAJBgNVBAYTAlVTMRYwFAYDVQQKEw1MZXQncyBFbmNyeXB0MQswCQYDVQQD
EwJSMzAeFw0yNDA0MjExMDIxNTNaFw0yNDA3MjAxMDIxNTJaMCYxJDAiBgNVBAMT
G2Zhc3RseS5hbnRvaW5lYnJvc3NhdWx0LmNvbTCCASIwDQYJKoZIhvcNAQEBBQAD
ggEPADCCAQoCggEBAKUvv7yBbdGbuSkRqk9DIr5+6PixAy8v+BrHs/peAke2eynx
PuyB7DphtXYA6Te7m9h8k2wgSnSM1aptQXb12GF7h8y+OKyjrkuP4ndkoA12Qsn9
8+yFhISrat46eyouZnr3rTNcjZiMBJWp750OMv058P03Uxfj+NENt9pdmSZG0+ad
SpoHX5jeU8qKnfOSbIYatRUo5WHVjwpoVHS2yu0Xp5HnaFdlhJiarssF6GLJtQHm
vOVgs0kXaZwlP870Im18FGfbNrfxqW34kZWM8VEMSOk0yFh1+8mba3yEhBdp/QT4
wHc+Q4lnnfYSeg3o6I7ve5Y5AkAb1JYVaNBoRb0CAwEAAaOCAh0wggIZMA4GA1Ud
DwEB/wQEAwIFoDAdBgNVHSUEFjAUBggrBgEFBQcDAQYIKwYBBQUHAwIwDAYDVR0T
AQH/BAIwADAdBgNVHQ4EFgQUiVZ3i4Whuk/cl9WqjxJzpFBJOPEwHwYDVR0jBBgw
FoAUFC6zF7dYVsuuUAlA5h+vnYsUwsYwVQYIKwYBBQUHAQEESTBHMCEGCCsGAQUF
BzABhhVodHRwOi8vcjMuby5sZW5jci5vcmcwIgYIKwYBBQUHMAKGFmh0dHA6Ly9y
My5pLmxlbmNyLm9yZy8wJgYDVR0RBB8wHYIbZmFzdGx5LmFudG9pbmVicm9zc2F1
bHQuY29tMBMGA1UdIAQMMAowCAYGZ4EMAQIBMIIBBAYKKwYBBAHWeQIEAgSB9QSB
8gDwAHcAPxdLT9ciR1iUHWUchL4NEu2QN38fhWrrwb8ohez4ZG4AAAGPAGQlVQAA
BAMASDBGAiEA2pFPY9Xkj+v3T1AztZrMk04KICg6BvuZVgy5ZZku4w0CIQCoNsss
9HUmz5/BQTS7Sx+vehZOYnTc5J81jZ2n2z2yiQB1AEiw42vapkc0D+VqAvqdMOsc
UgHLVt0sgdm7v6s52IRzAAABjwBkJVsAAAQDAEYwRAIgD/b65Dh6XTc19KBGqa1e
PBu5Iug4mRoP/krVXh9+yNUCIGtm7n6jjbUQd/uffeITCKowk548eHr6vNa+WI8i
wb58MA0GCSqGSIb3DQEBCwUAA4IBAQAMTalK6KRXtqmWZA8DGmevLlL15ao464II
S3HziUs9e22v6z2pQ4GkWicht3/V0LxgfUV0isJB7yCQqT2QRpqGaUQwYP1E0goS
JNAbd8rPPWTYCeN1lDF90S3GAfRclH4R92DzIFPuL31nRutzF2fRoHGVuYCXPfFl
SAS2mEW/Hwq5QcLzzMa04zQPzgnKRYpt81DZO3t1TvsfosuLTnESR1xfHnVv4ags
SJEowRK+W3Po8NZc/SYGqm4NibRQ29SFot9rkqhYK/Yl+Lv1TfMR3spa6KoUs4UW
eFjTEmsek39Ye1OytPKjulgt8qsXtI2cUM02+7g8Vz/rlM6jpOnO
-----END CERTIFICATE-----
subject=CN=fastly.antoinebrossault.com ⬅️⬅️⬅️⬅️
issuer=C=US, O=Let's Encrypt, CN=R3
---
No client certificate CA names sent
Peer signing digest: SHA256
Peer signature type: RSA-PSS
Server Temp Key: X25519, 253 bits
---
SSL handshake has read 4527 bytes and written 399 bytes
Verification: OK
---
New, TLSv1.3, Cipher is TLS_AES_128_GCM_SHA256
Server public key is 2048 bit
This TLS version forbids renegotiation.
Compression: NONE
Expansion: NONE
No ALPN negotiated
Early data was not sent
Verify return code: 0 (ok)
---
Using Curl
Curl is a command-line tool for transferring data with URLs, and it supports various protocols, including HTTP and HTTPS. To test SNI with Curl, follow these steps:
- Open a terminal.
- Run the Curl command with the
-v(verbose) option, specifying the URL of the site you want to test.
curl -v https://fastly.antoinebrossault.com
Here’s what each part of the command does:
– -v: Enables verbose mode, providing detailed information about the connection process.
– `https://fastly.antoinebrossault.com`: The URL of the site you want to test.
- Examine the output: Look for lines starting with
*, which contain information about the SSL handshake. Pay attention to theServer certificatesection to ensure that the correct certificate is being used for the hostname.
Curl Example Output:
❯ curl -v https://fastly.antoinebrossault.com
* Host fastly.antoinebrossault.com:443 was resolved.
* IPv6: (none)
* IPv4: 151.101.3.52, 151.101.67.52, 151.101.131.52, 151.101.195.52
*   Trying 151.101.3.52:443...
* Connected to fastly.antoinebrossault.com (151.101.3.52) port 443
* ALPN: curl offers h2,http/1.1
* (304) (OUT), TLS handshake, Client hello (1):
*  CAfile: /etc/ssl/cert.pem
*  CApath: none
* (304) (IN), TLS handshake, Server hello (2):
* (304) (IN), TLS handshake, Unknown (8):
* (304) (IN), TLS handshake, Certificate (11):
* (304) (IN), TLS handshake, CERT verify (15):
* (304) (IN), TLS handshake, Finished (20):
* (304) (OUT), TLS handshake, Finished (20):
* SSL connection using TLSv1.3 / AEAD-CHACHA20-POLY1305-SHA256 / [blank] / UNDEF
* ALPN: server accepted h2
* Server certificate:
*  subject: CN=fastly.antoinebrossault.com ⬅️⬅️⬅️⬅️
*  start date: Apr 21 10:21:53 2024 GMT
*  expire date: Jul 20 10:21:52 2024 GMT
*  subjectAltName: host "fastly.antoinebrossault.com" matched cert's "fastly.antoinebrossault.com" ⬅️⬅️⬅️⬅️
*  issuer: C=US; O=Let's Encrypt; CN=R3
*  SSL certificate verify ok.
* using HTTP/2
* [HTTP/2] [1] OPENED stream for https://fastly.antoinebrossault.com/
* [HTTP/2] [1] [:method: GET]
* [HTTP/2] [1] [:scheme: https]
* [HTTP/2] [1] [:authority: fastly.antoinebrossault.com]
* [HTTP/2] [1] [:path: /]
* [HTTP/2] [1] [user-agent: curl/8.6.0]
* [HTTP/2] [1] [accept: */*]
> GET / HTTP/2
> Host: fastly.antoinebrossault.com
> User-Agent: curl/8.6.0
> Accept: */*
In both cases, ensure that the subject or subjectAltName field matches the domain you are testing. This confirms that the correct certificate is being presented based on the SNI.
By following these steps, you can verify that SNI is configured correctly on your server and that the appropriate certificates are being used for secure connections.
Introduction
Nikto is a powerful, open-source web server scanner designed to identify potential security issues and vulnerabilities in web servers. It plays a crucial role in assessing the security posture of web applications by detecting outdated software versions, misconfigurations, and dangerous files. One of its valuable applications is in testing the implementation and effectiveness of Web Application Firewalls (WAFs), ensuring they provide the intended security protections.
Use Cases
Identifying Vulnerable Software Versions: Nikto scans for outdated versions of web servers and software that might be susceptible to known vulnerabilities.
Detecting Insecure Files and Scripts: It identifies default and potentially dangerous files/scripts that might be inadvertently left on the server.
Server Configuration Analysis: The tool checks for common misconfigurations that could lead to security issues.
Testing Web Application Firewalls: By simulating various attack patterns, Nikto can help assess the effectiveness of a WAF in blocking malicious traffic.
Security Audits and Compliance: Useful for conducting regular security audits and ensuring compliance with security standards.
Setting Up Nikto with Docker
Using Docker simplifies the setup and ensures a consistent environment for running Nikto. Here’s how to set it up:
Install Docker: Make sure Docker is installed on your system. You can download and install it from Docker’s official website.
Pull the Nikto Project : Open a terminal and pull the Nikto repo from GitHub with the following command:
git clone https://github.com/sullo/nikto.git
Go to the folder :
cd nikto
Build the image :
docker build -t sullo/nikto .
Run Nikto: You can run Nikto against a target web server using the pulled Docker image:
docker run --rm sullo/nikto -Display V -h [target_ip_or_domain]
Useful Options
Target Host (-h): Specify the target host to scan.
docker run --rm sullo/nikto -h example.com
Verbose (-Display V): Print each request on the screen.
docker run --rm sullo/nikto -Display V -h example.com
Port (-p): Define the port to scan (default is 80).
docker run --rm sullo/nikto -h example.com -p 8080
Output Format (-o and -Format): Save the scan results in various formats such as HTML, CSV, or XML.
docker run --rm sullo/nikto -h example.com -o results.html -Format html
Plugins (-Plugins): Run specific plugins for more targeted testing.
docker run --rm sullo/nikto -h example.com -Plugins outdated
Conclusion
Nikto is a versatile and essential tool for web server security assessments, particularly useful for verifying the implementation and effectiveness of Web Application Firewalls. Its comprehensive scanning capabilities and ease of use, especially when set up with Docker, make it a valuable asset for security professionals aiming to safeguard web applications. Whether for routine security audits or compliance checks, Nikto helps in identifying and mitigating potential vulnerabilities effectively.